Property Newsletter | July 2023
Madiba magic not enough for Eastern Cape
Eastern Cape’s property landscape
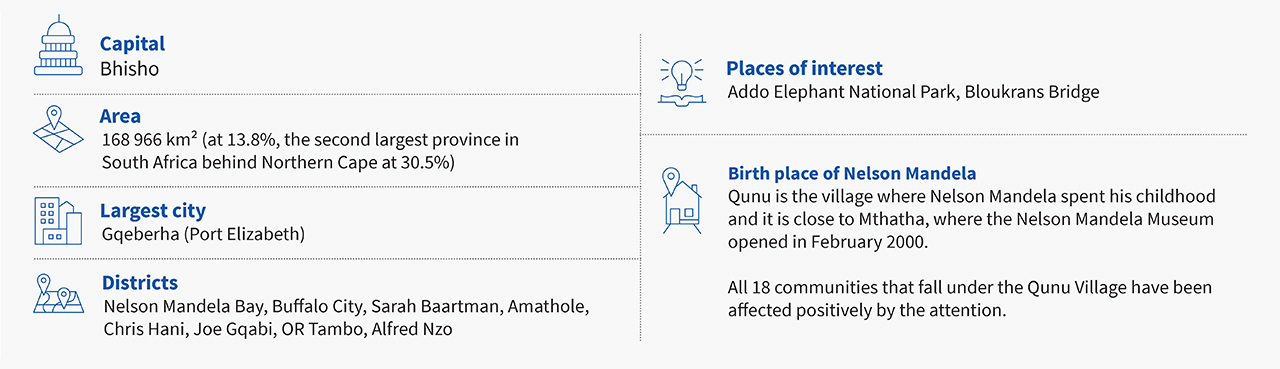
Eastern Cape at a glance
Slow population growth, a high proportion of non-economically active people and a significant rural population characterise the Eastern Cape’s unfulfilled promise, as does the province’s underperforming residential property market.
The Eastern Cape’s contribution to South Africa’s national GDP has been falling since 2011, and the province has the country’s highest level of unemployment. Manufacturing is the largest economic sector, followed by construction, with relatively little mining activity. The Eastern Cape has some of the world’s best beaches and 800km of unspoilt coastline which could be the basis of an improved tourism economy.
Eastern Cape % of national GDP, 2010-2021 (a)
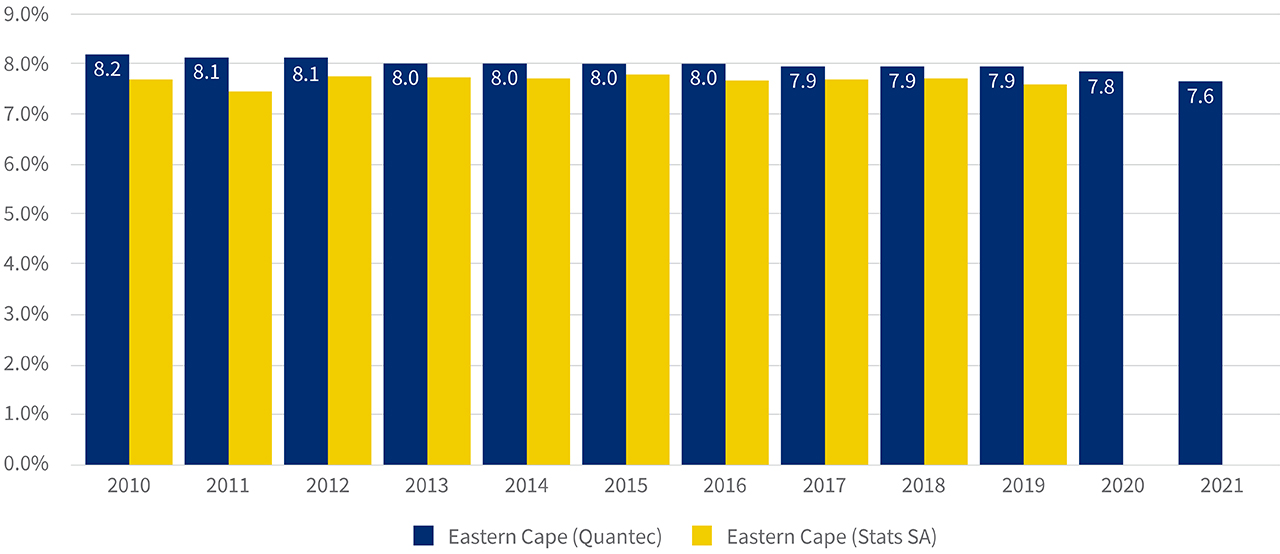
Source: Statistics South Africa and Quantec. Note (a): % of national GDP is calculated at GVA basic prices at constant 2021 prices.
Slow population growth tells a story
The Eastern Cape is South Africa’s second largest province by size, and fourth largest in terms of population at 6.7 million people – but it’s population grew by just 2% over the past 11 years compared to the national average of 17%.
Looking back over more than 20 years, the Eastern Cape’s share of South Africa’s population has fallen from 14% in 2001 to 12.6% in 2011 and down to an estimated 11% in 2022, according to StatsSA.
While the province has a declining population – largely because job seekers leave for other provinces, particularly the Western Cape – more than a third of those left behind are children (the highest proportion in the country) and it has the highest percentage of older people (11.6% compared to the national average of 9.2% and 10.7% in neighbouring Western Cape). The graphic below shows how the Eastern Cape lags Gauteng in terms of proportion of adults aged 25-39, but outstrips Gauteng in terms of both children under 14 and the elderly.
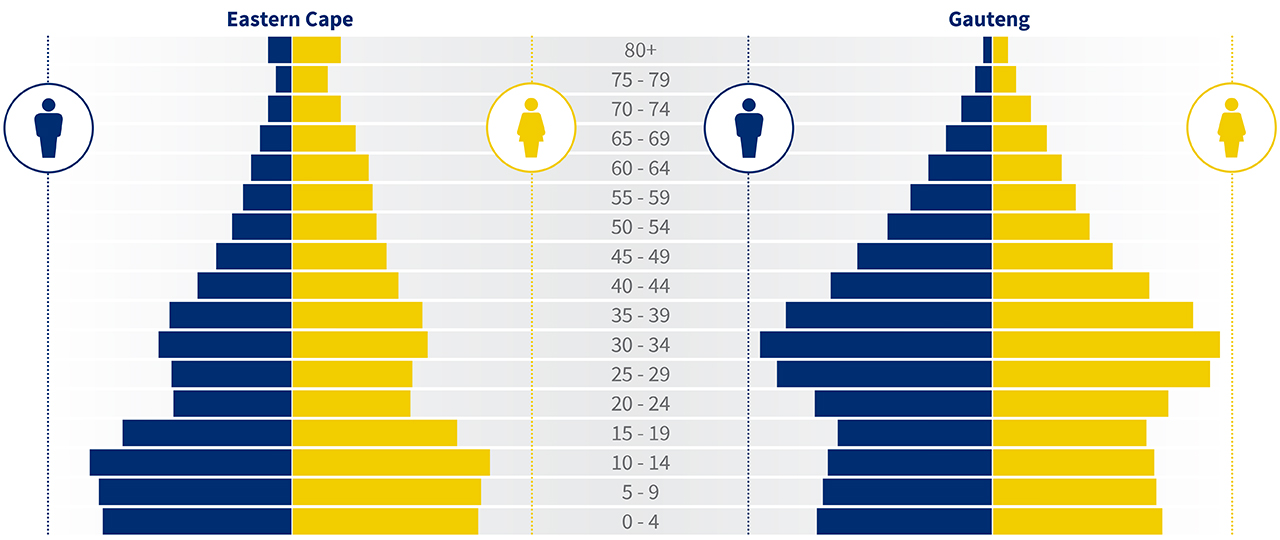
Gauteng has a higher proportion of adults aged 25 - 39 when compared to Eastern Cape, which has a higher proportion of children aged 0 - 14 and elderly within the province.
There are 1.7 million households spread across 33 municipalities and 114 towns, with 50% of adults and 55% of children living in rural areas. The household size in rural areas is 4.5 people per household compared to 3.5 people in urban areas.
Rural households earn less than urban ones: 60% earning less than R12k a month are in rural areas, and only 10% of those earning more than R12k a month are from rural areas.
The Eastern Cape is one of the poorer provinces, with nearly 80% of the population living in areas where the average income is under R12k per household per month. This compares to less than 60% in Gauteng and 50% in the more economically prosperous Western Cape.
Income distribution
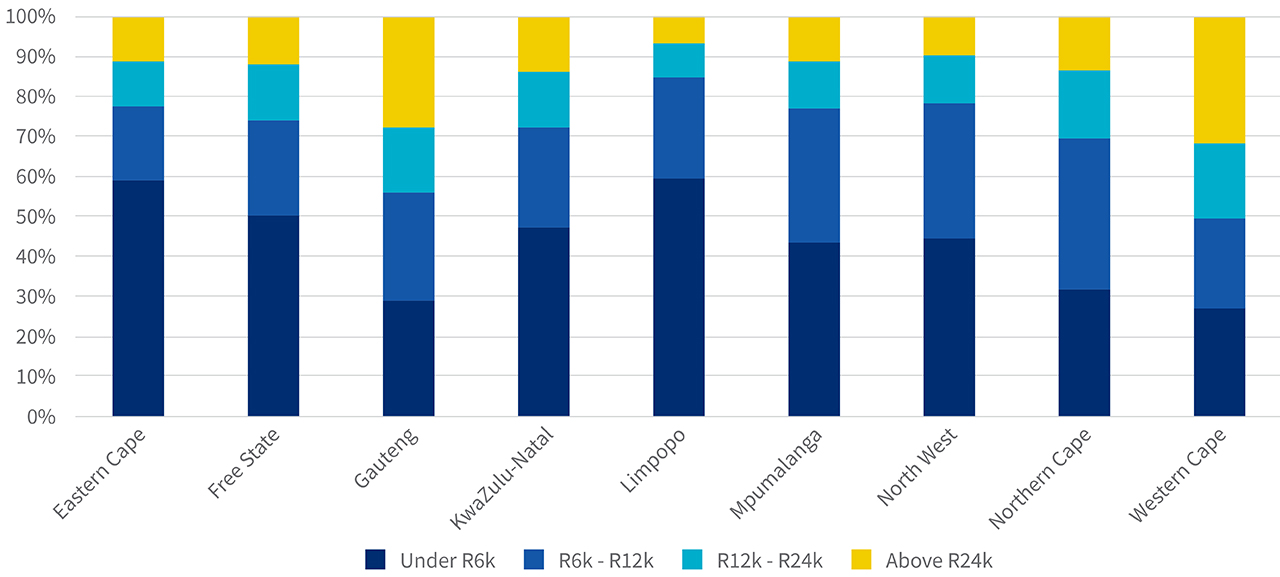
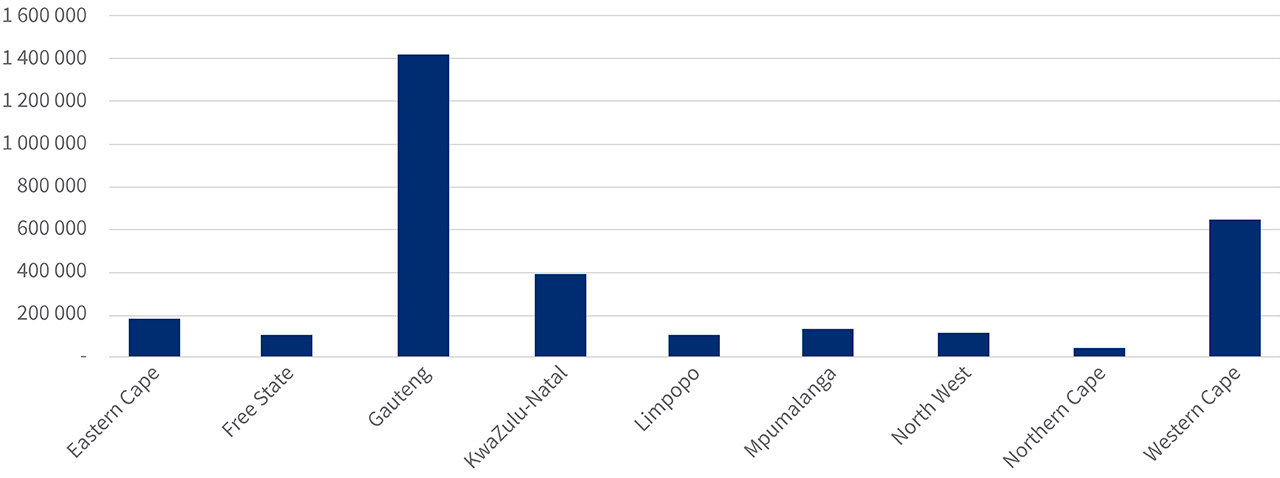
However, even with such a large proportion of the population earning on the lowest end, due to its relatively big population, the Eastern Cape has more households, in absolute numbers, where the average income exceeded R24k per month, and only Gauteng, Western Cape and KZN have more households above this cutoff.
Households earning more than R24k per month
Small towns punch above their weight in property sales
The Eastern Cape’s major cities, Gqeberha and East London, along with the popular surfing town, Jeffrey’s Bay, accounted for 62% of the province’s residential property sales by volume in 2022 – but average sale prices were highest in smaller coastal towns buoyed by the second holiday home market and a growing demand from remote workers keen for a better quality lifestyle.
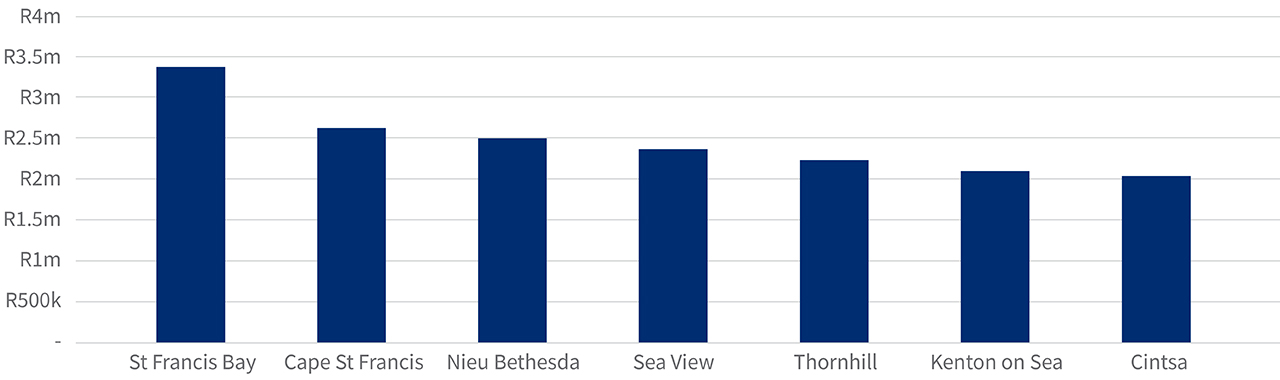
Residential property sales transactions in the R200k-R20m price band in the Eastern Cape amounted to R10b in 2022 – and while nearly two thirds of the sales were recorded in the cities, average sales prices were highest in Cape St Francis (R2.4m) and St Francis Bay (R2.1m) followed by Sea View, Kenton-on-Sea and Port Alfred (around R1.5m).
The average value of houses in the province is highest in smaller towns as the graph below shows.
Towns with highest average value properties (excluding properties valued under R250k)
The average sales price in East London was R1.4m, higher than Gqeberha at R1.2m (although the latter accounted for more than double the sales volumes), but both were lower than the average in Cape Town at R2.7m, and Gqeberha is also lower than George at R2.3m and Durban at R1.3m.
The property market in the Eastern Cape lags Gauteng in terms of value, with 12% of Gauteng properties valued at above R2m but only 4% in the Eastern Cape making the cut. The five year churn in the R200k-R20m band was only 8% in the Eastern Cape compared to 17% in Gauteng.
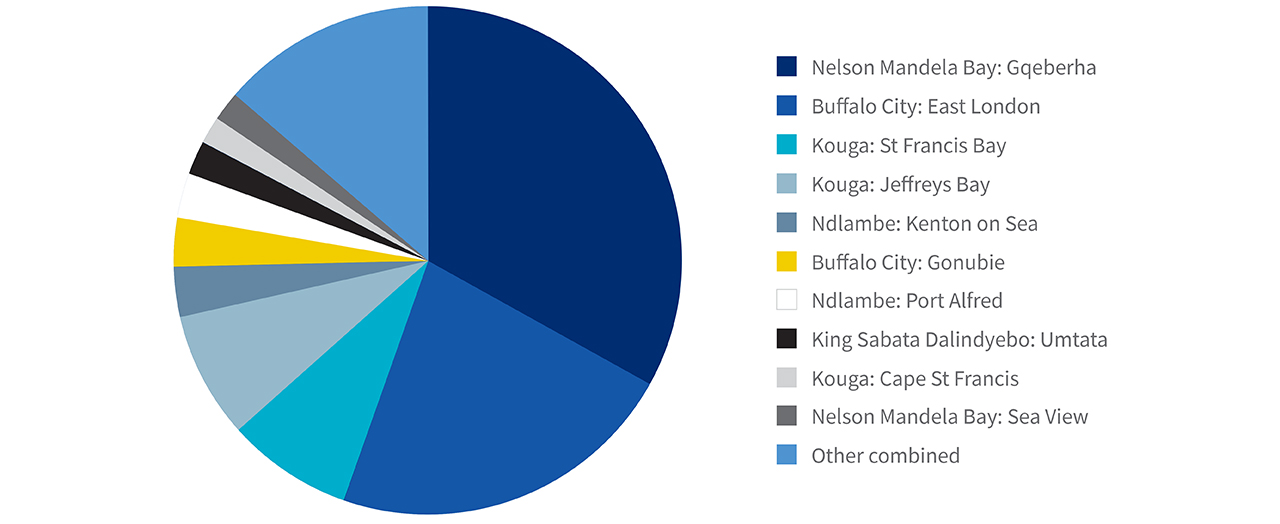
There are towns and cities with a significant number of properties valued above R2m, but with a solid component of mid-range properties they don’t feature in the highest average list. The 32 000 properties exceeding R2m in value are spread widely along the coastline, as the graph below demonstrates.
Spread of R2m plus properties
Where people live and shop
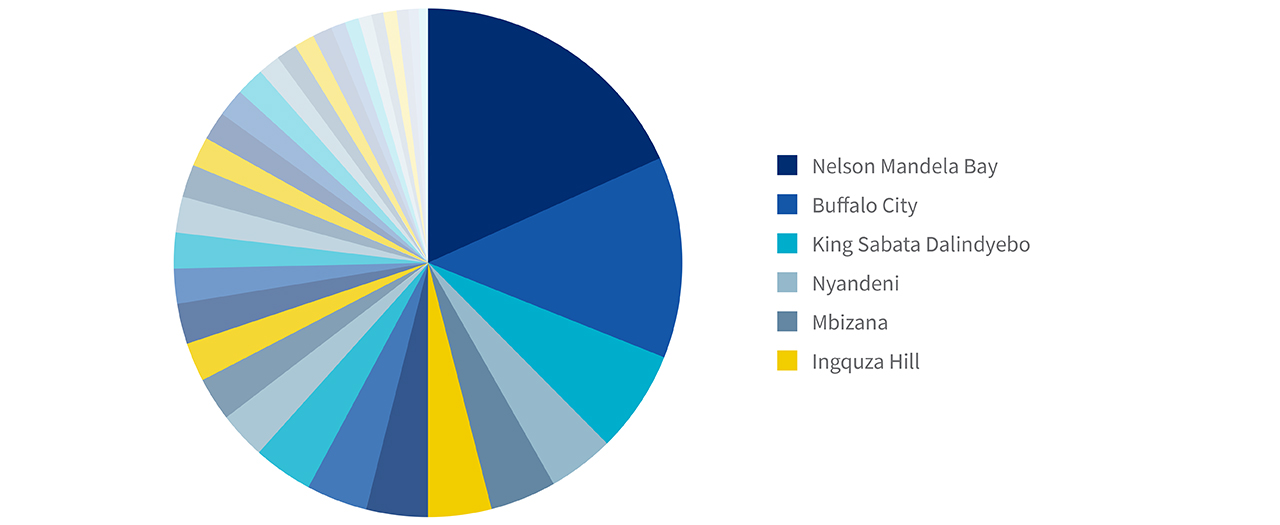
Some 50% of people live in six municipalities along the coast: Nelson Mandela Bay, Buffalo City and King Sabata Dalindyebo (which includes Mthatha and Mqanduli) dominate with 38% (see graph below) followed by Nyandeni, Mbizane and Ingquza Hill.
Municipal distribution

Winnie Madikizela-Mandela Local Municipality is a local municipality in Alfred Nzo District Municipality in the Wild Coast Region of the Eastern Cape Province in South Africa. The name Mbizana means “little casserole” or “sauce pan” in isiXhosa.
Taking a look at where people shop, Gqeberha’s Green Acres is the busiest mall in the province, with about double the volume of visitors to Bay West. Walmer Park is the second busiest. Vincent Park (similar volumes to Walmer Park) and Hemingways (similar volumes to Bay West) is busiest in East London.
Estimates for mall visits in the Eastern Cape’s 10 busiest towns in May 2023
Gqeberha
1m
East London
500k
Umtata
150k
King Williams Town
100k
Uitenhage
90k
Queenstown
80k
Jeffreys Bay
75k
Bethelsdorp
65k
Grahamstown
60k
Mdantsane
60k
.png)
.png)
.png)
.png)