Property Newsletter | February 2023
Low in volume, high in value!
Greatest value growth is in Estates in SA’s residential property market
Residential buyers are opting for Sectional Schemes and Estates in greater numbers, as security, convenient living and greater availability across price bands drive sales.
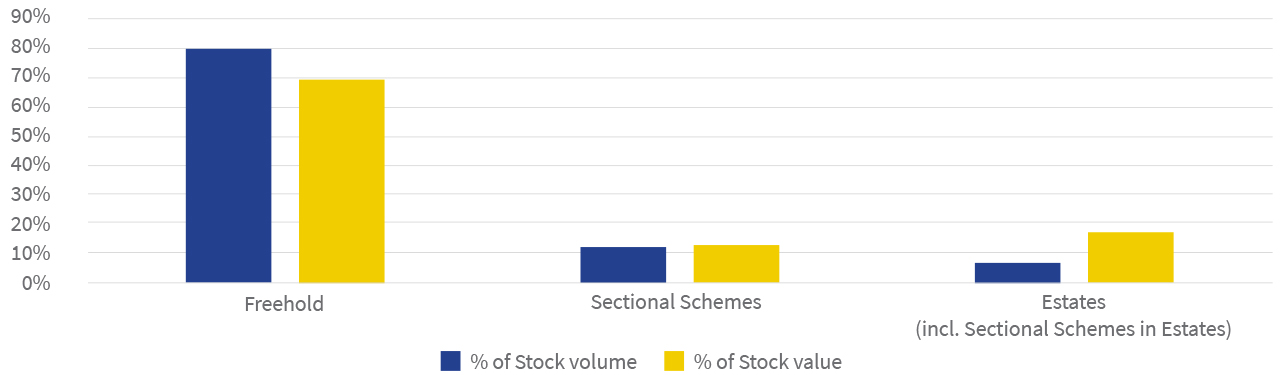
Sectional Schemes and Estates make up less than 20% of South Africa’s more than 7 million registered residential properties, but account for 30% of their value.
While Estates make up just 7% of the properties – between 430k-460k properties in 5 000 Estates – the category accounts for 17% of the market’s value (see graph below).
Total residential stock value and volume
Total stock
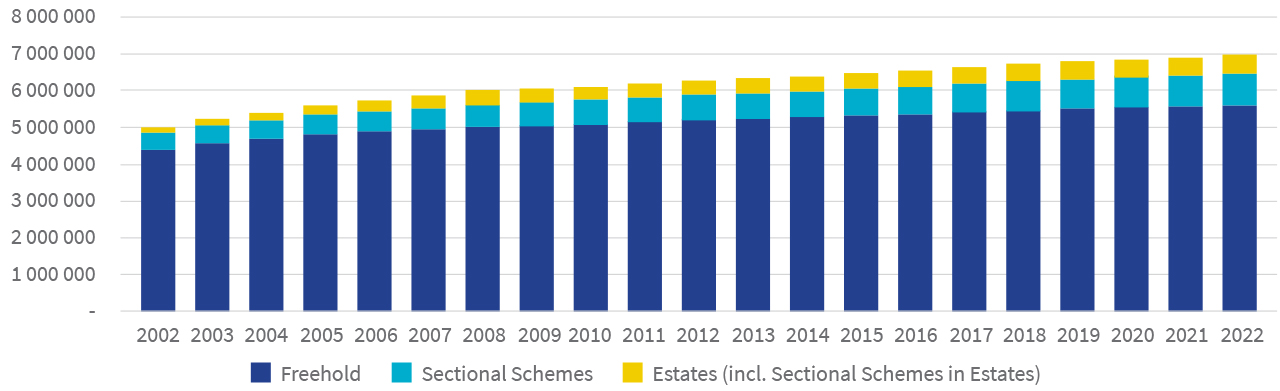
Most properties in Estates are Freehold, although Sectional Scheme units are increasing in number. The growth of Estates overall has slowed in the last 10 years compared to the previous decade, along with the rest of the market.

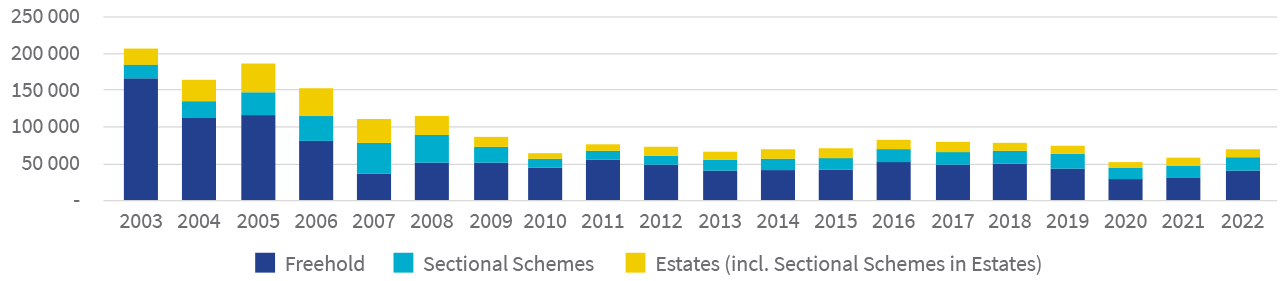
Residential property development and transactions over the last 20 years
The development of new residential stock was declining slowly prior to the 2008-9 financial market crash, and has never fully recovered to pre-crash levels. Total new stock on the market (see graph below) has fluctuated between 50 000 and 75 000 units a year since then.
Stock growth
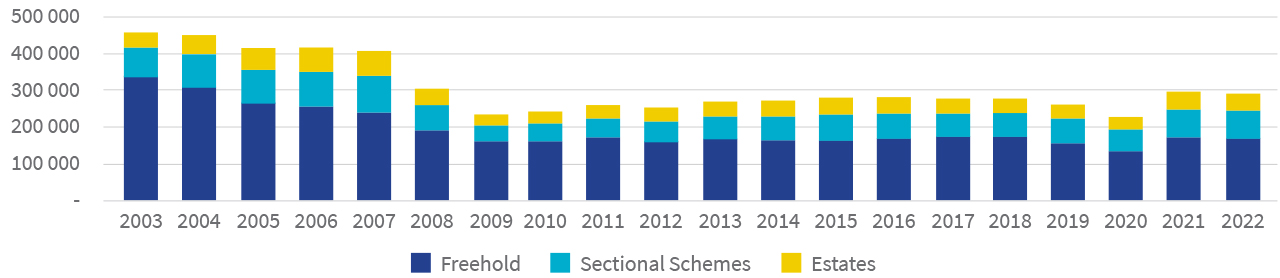
Sectional Schemes and Estates have recovered better than Freehold, which reflects in part a shift towards the secure, convenient living the two categories offer. Total residential sales did stabilise and recover slightly after the crash (see graph below), but fell again during Covid-19 in 2020 – although the recovery since then, driven by Sectional Schemes and Estates, has been encouraging and overall the best since 2008.
Sales transactions volumes
Estates average sales prices higher than Sectional Scheme and Freehold sales
Average sales price - Freehold
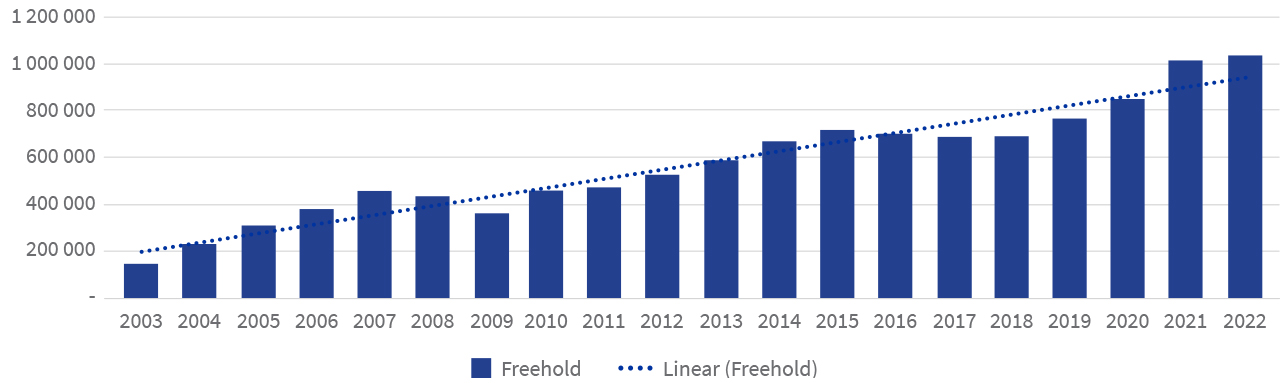
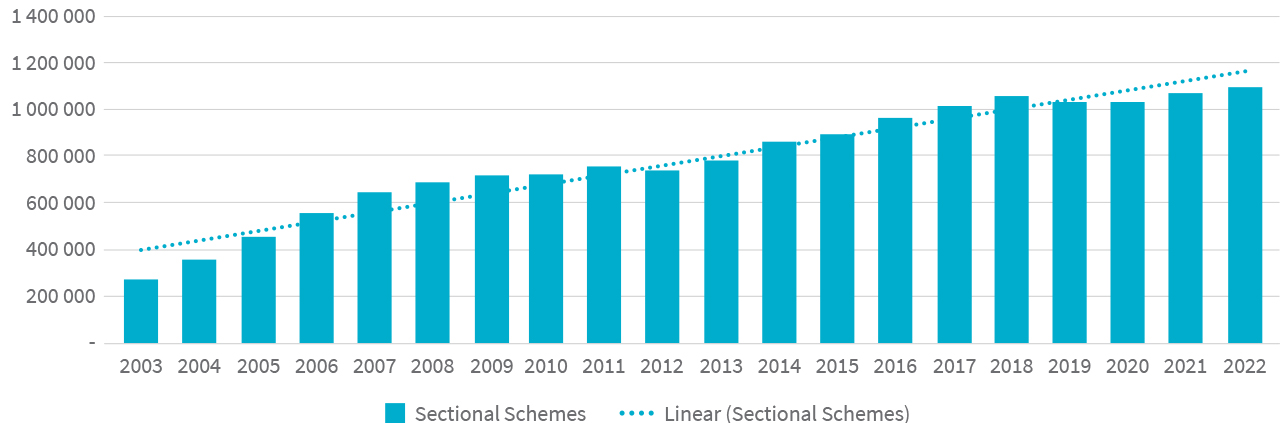
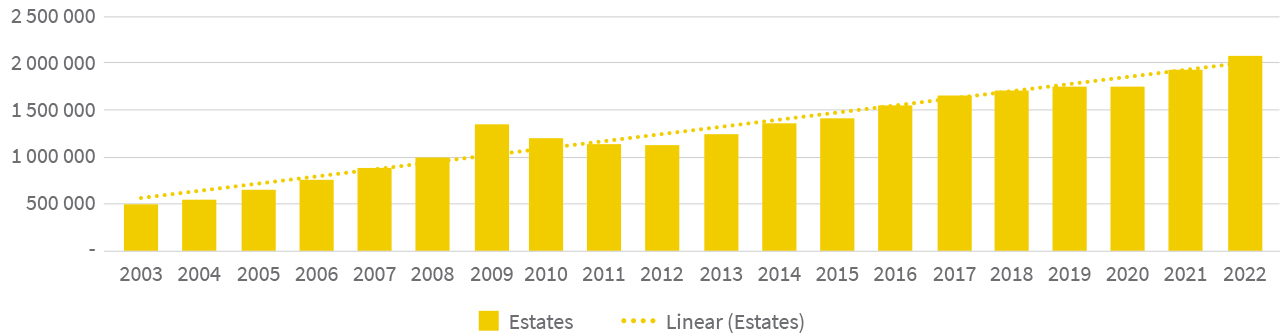
These three graphs (one above, two below) show how the average sales price in Estates has outperformed Sectional Schemes and Freehold – but it is worth bearing in mind that the average sales price partly reflects the mix of properties sold (built houses vs vacant stands) in a given period, partly the buoyancy or otherwise of the property market at that time, and partly a preference for a particular type of property at that time.
Average sales price - Sectional Schemes
Average sales price - Estates
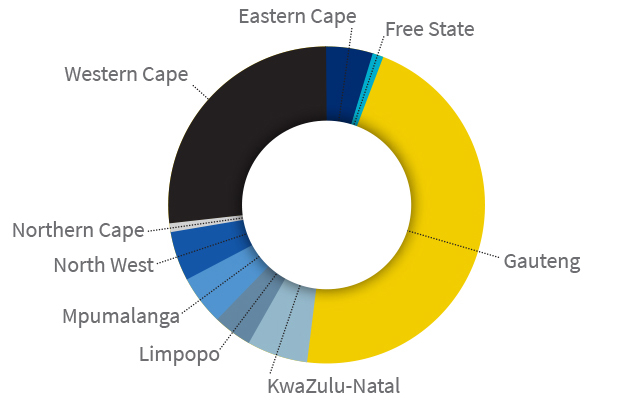
Gauteng, Western Cape dominate Estate markets
Estates in the Western Cape are growing the fastest, followed by Gauteng and then KwaZulu-Natal, and the two provinces (Western Cape and Gauteng) account for 70% of all Estate properties in the country. The first graph below (left) shows how the Western Cape, KwaZulu-Natal and Gauteng dominate the Estate market, while a comparison with the second graph (right) demonstrates that the Estate market in the Western Cape and Gauteng market is proportionately larger than their share of the total residential market.
Estate properties per province
Total residential properties per province
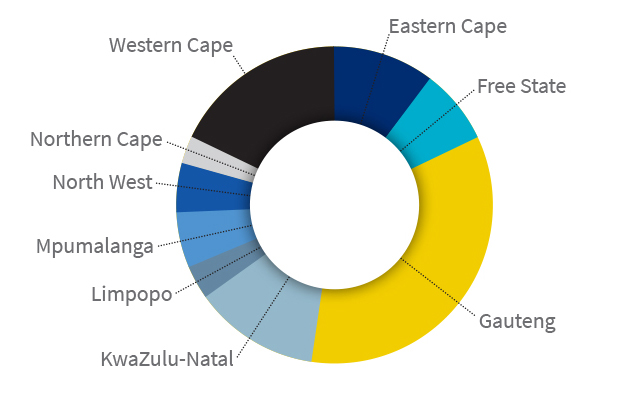
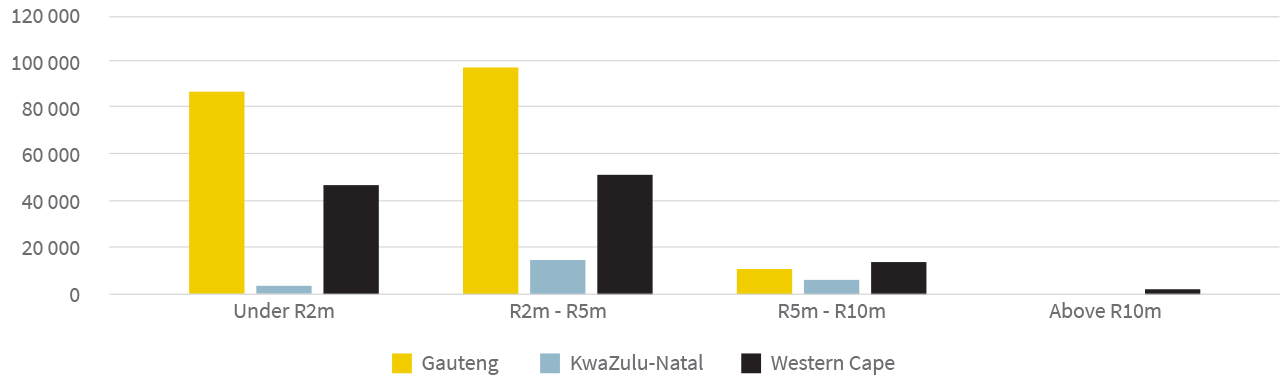
The graph below demonstrates that Gauteng dominates the Estate market in tems of numbers of units, but the Western Cape has a higher volume of Estates in the higher values (R5m-R10m and above R10m).
Number of Estate properties by value in Gauteng, KwaZulu-Natal and Western Cape
Increased number of lower value properties in Estates on the market
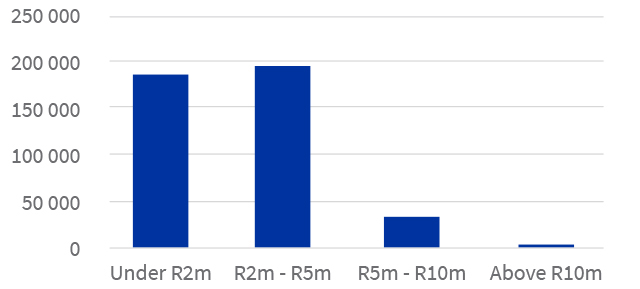
The Estate market has broadened over the past 20 years. The graph below (left) demonstrates the value of Estate properties at the end of 2022, which indicates lower value properties make up a significant portion of stock in a break from early convention which saw developments almost exclusively weighted towards larger, expensive properties.
By the end of 2022, there were nearly 190 000 Estate properties valued at less than R2m, while 196 000 were worth between R2m-R5m, with almost 35 000 worth more than R5m.
Value of Estate properties at end 2022
Average Estate property value
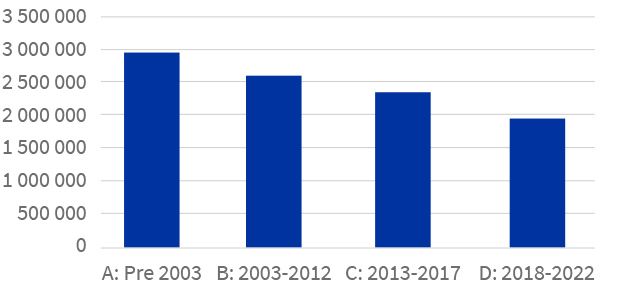
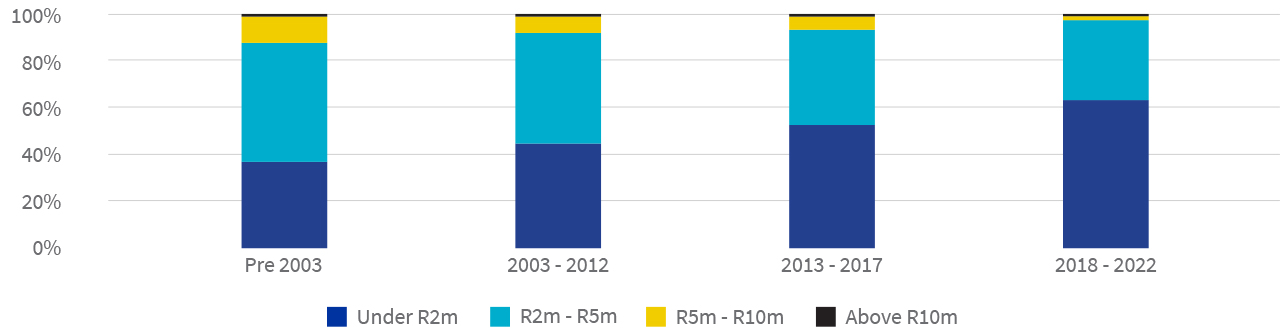
The graph above (right) shows how the average value of Estate stock reduced during the periods pre-2003, 2003-2012, 2013-2017 and 2018-2022 – in other words, as the graph below shows, the proportion of stock under R2m in value increased in each period.
Property values by age of Estate
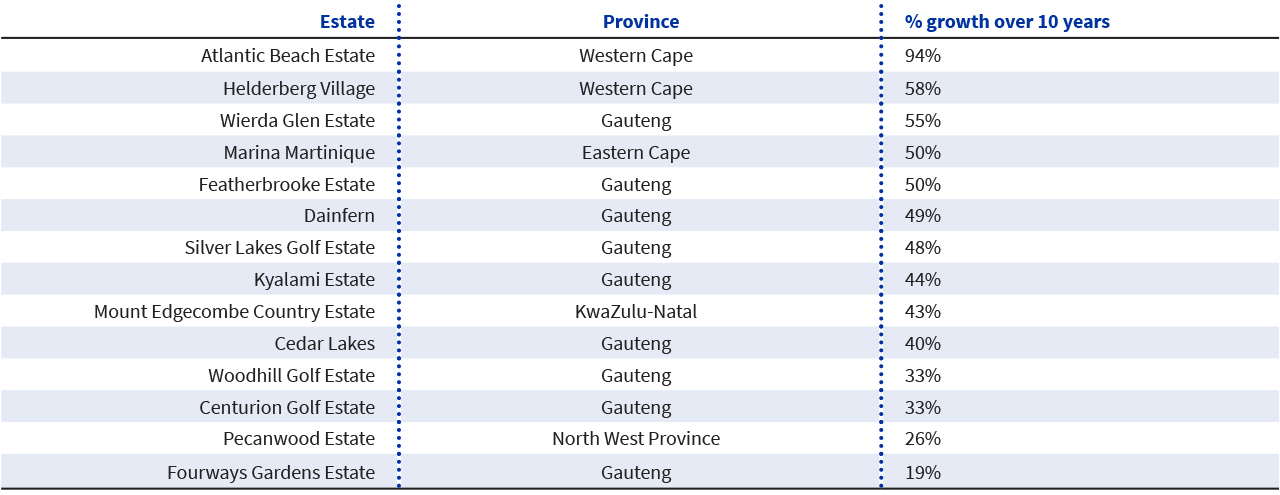
Growth in value over 10 years in randomly selected, well-known Estates
.png)
.png)
.png)
.png)