Property Newsletter | September 2022
Less is more
Transfer volumes better, value of deals jump in post-Covid-19 property bounce
…while new residential property development also shows signs of recovery
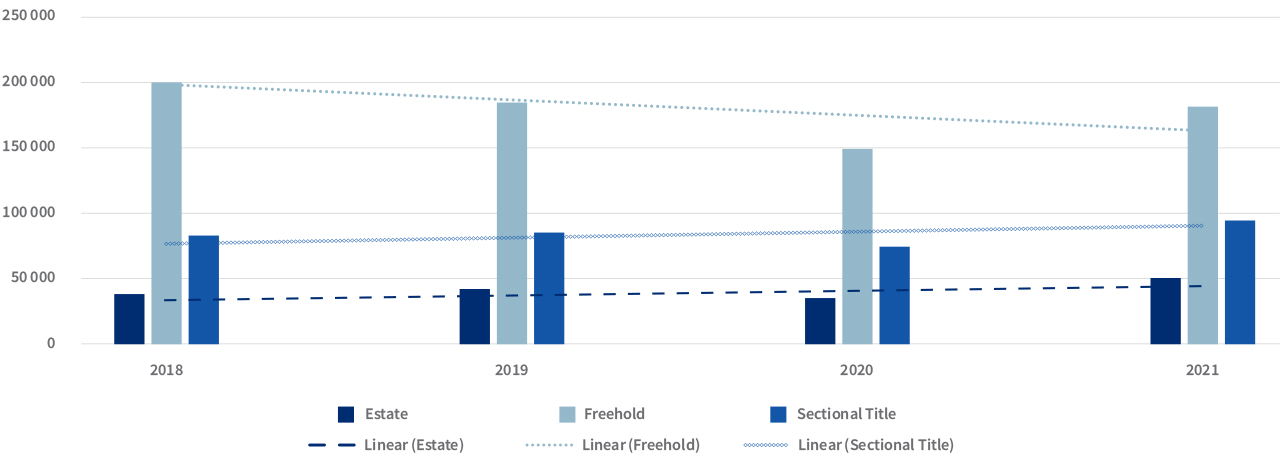
Residential property transfers in 2021 (330 105) edged ahead of 2018 (326 549) as the market recovered from the fall to 262 761 transfers in 2020, when Covid-19 lockdowns took their toll.
However, the average number of transfers over the last four years is lower than the totals recorded in 2018, 2019 and 2021, suggesting the market continues a gentle decline in volume terms. The decline is driven by falling transfers in Freehold property, which in 2021 was nearly 10% down on its 2018 numbers. Both Estate and Sectional Title are trending marginally up since 2018.
Volume of transfers
| Estate | Freehold | Sectional Title | TOTAL | |
|---|---|---|---|---|
| 2018 | 42 845 | 202 513 | 81 191 | 326 549 |
| 2019 | 41 311 | 185 295 | 84 835 | 311 441 |
| 2020 | 35 949 | 152 477 | 74 335 | 262 761 |
| 2021 | 50 166 | 184 241 | 95 698 | 330 105 |
Transfer volumes: 2018-2021
While the volume of properties transferred has fallen, the value of the transactions has risen, confirming previous data which showed that the mid to upper price bands have outperformed the entry level and lower bands. The value of transfers in 2021 was R334b, well up on the R245b recorded in 2018 and a significant recovery from the R225b in 2020.
The R334b recorded in 2021 was also well ahead of the average of R261.5b for the four years, 2018-2021, driven by a spike in the value of Freehold sales.
Transfer value: 2018-2021
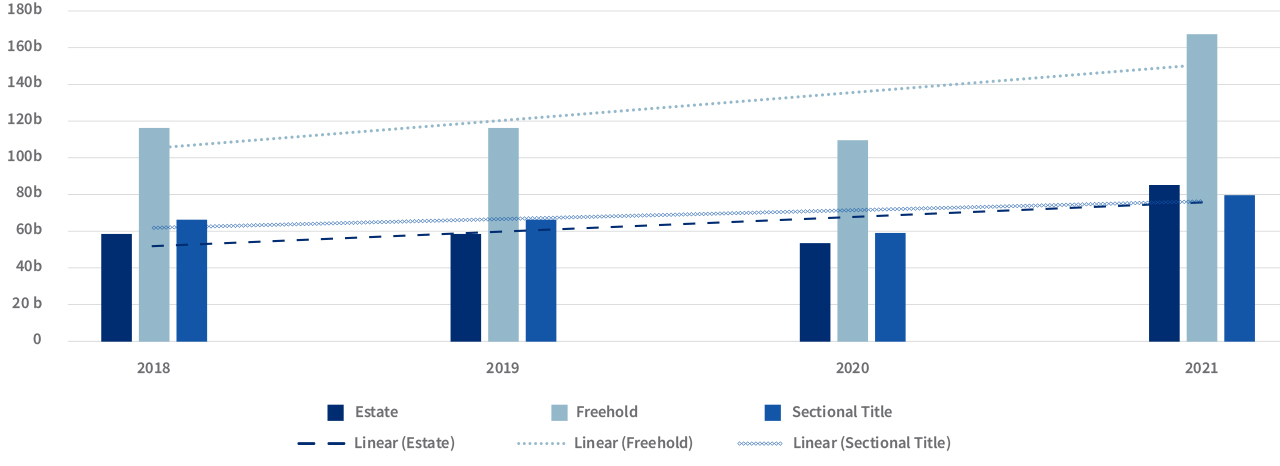
Value of transfers
| Estate | Freehold | Sectional Title | TOTAL | |
|---|---|---|---|---|
| 2018 | 60 138 437 862 | 117 753 834 506 | 66 639 032 206 | 244 531 304 574 |
| 2019 | 59 171 784 157 | 116 849 760 304 | 66 413 743 053 | 242 435 287 514 |
| 2020 | 55 006 391 339 | 110 642 564 520 | 59 528 278 127 | 225 177 233 986 |
| 2021 | 85 787 828 562 | 165 884 221 498 | 82 069 556 225 | 333 741 606 285 |
| 2022 | 56 073 042 684 | 107 461 463 451 | 52 036 916 875 | 215 571 423 010 |
New developments start to recover
New residential property development has recovered slightly from the crash of 2020, with 55 695 new properties in 2021 compared to 51 106 in 2020. But the 2021 number is still significantly lower than the 73 012 recorded in 2019, which was itself already a drop from the 77 509 new properties recorded in 2018.
As the two graphs below show, new Freehold residential development fell by almost 40% from the 50 271 units which came onto the market in 2018 to 29 872 in 2021 – although sales in 2022 could edge past last year’s total.
New stock volumes by property type: 2018-2021
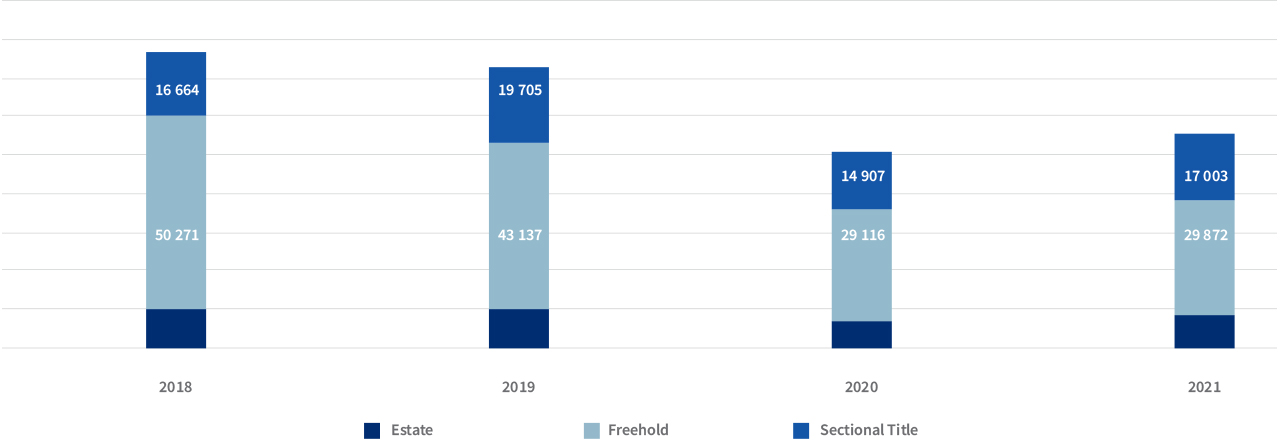
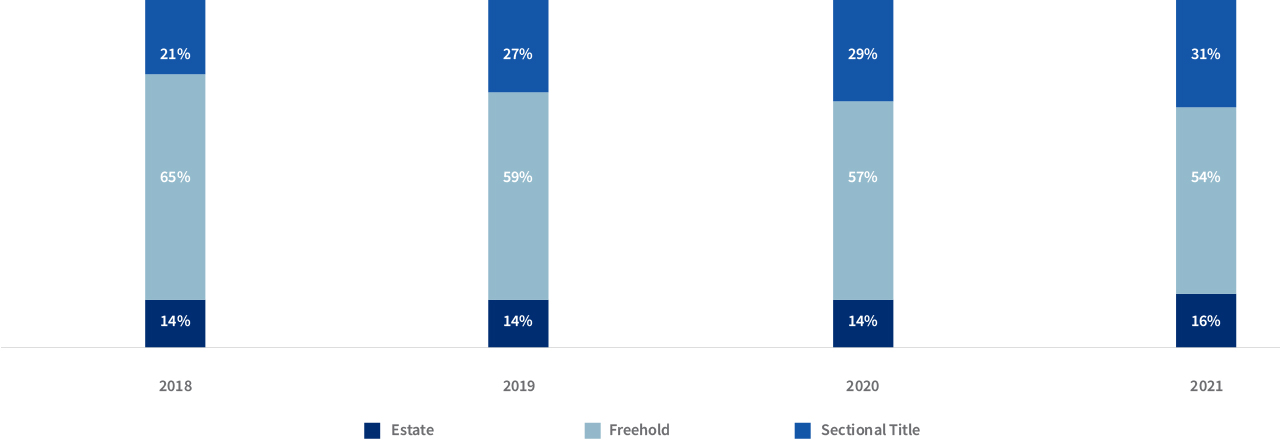
While Freehold continues to lose appeal, Sectional Title remained relatively buoyant during 2021, with new properties falling to 14 907 from 19 705 in 2019, but then recovering strongly to 17 003 in 2021. As a percentage of the total number of new properties on the market, Sectional Title has risen from 21% in 2018 to 31% in 2021.
Estate volumes have fallen from 10 574 in 2018 to 8 820 in 2021. However, because of the drop in Freehold numbers, Estate accounted for 16% of all new properties in 2021, up from 14% in 2018.
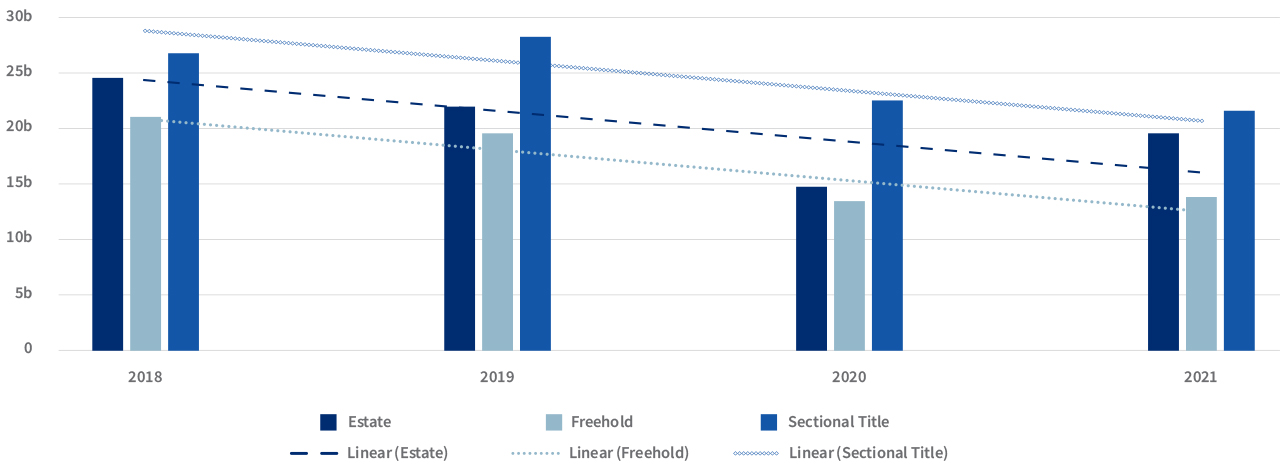
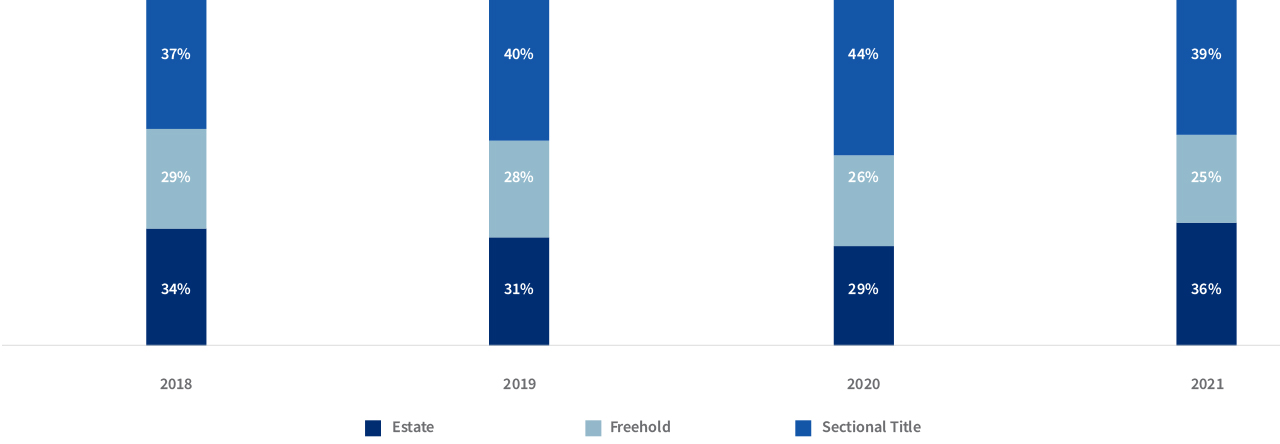
The value of new developments has also dropped from R73b in 2018 to R55b in 2021, which was up on the low of R50b in 2020. All three property types suffered reversals – Estate from nearly R25b in 2018 to R19.6b in 2021; Sectional Title from almost R27b to R21.4b in 2021 and Freehold fell the most, from R21.3b in 2018 to R14b in 2021.
Value of new developments by property type
| Estate | Freehold | Sectional Title | TOTAL | |
|---|---|---|---|---|
| 2018 | 24 818 230 000 | 21 365 162 000 | 26 915 555 000 | 73 098 947 000 |
| 2019 | 22 076 420 000 | 19 724 583 000 | 28 347 290 000 | 70 148 293 000 |
| 2020 | 14 622 230 000 | 13 312 971 000 | 22 306 100 000 | 50 241 301 000 |
| 2021 | 19 614 335 000 | 14 024 837 000 | 21 386 289 000 | 55 025 461 000 |
New development by property type - value: 2018-2021
Volume, value proportions point to where to find value – and what’s selling at a premium
The proportion of volume or value to property type graphs tell an interesting story – and confirm buyers place a premium on Estate living, followed by Sectional Title with Freehold offering good value.
Using 2021 as an example, Freehold accounted for 25% of the value of new stock but double that – 54% - in terms of volume. Sectional Title accounted for 39% of the value against 31% of the stock, but it is in Estates that a premium is being charged for properties, as they accounted for 36% of the value for just 16% of the volume.
The data holds over the four years being reviewed. Sectional Title has accounted for between 37% and 44% of stock value, and between 21% and 31% of value, while Estates have moved between 29% and 36% of value, and 14-16% of volume. While Freehold has been drifting downwards in terms of value, from 29% in 2018 to 25% in 2021, its share of the market in terms of volumes has gone from 65% to 54%.
Proportion of new stock value by property type: 2018 - 2021
Proportion of new stock volumes by property type: 2018-2021
Where do sellers go?
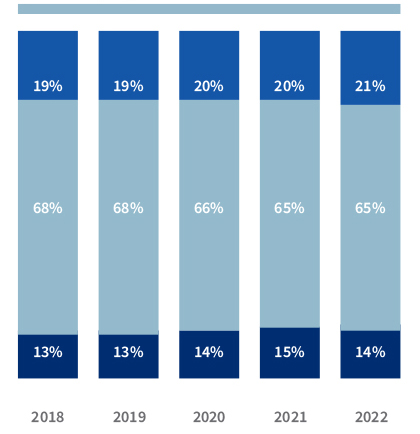
Sellers of Freehold have mostly stayed with Freehold, but the numbers are dropping, from 68% in 2018 to 65% in 2021. Purchases of Sectional Title have risen by 1% from 19% to 20% in 2021, while Estates have climbed a little more in percentage terms, from 13% to 15% in the same period.
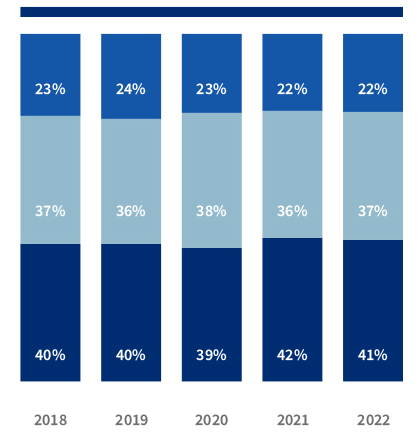
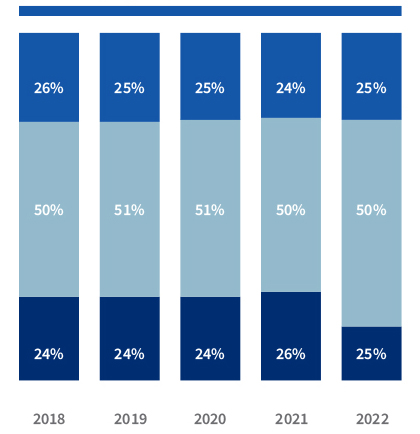
The consistency of purchase choices is evident in both sellers of Estate and Sectional title properties. Most sellers in an Estate buy back into an Estate (42% in 2021) or Sectional Title (36% in 2021), while most sellers of Sectional Title opt for Freehold (50% in 2021), Estates (26% in 2021) while just 24% bought Sectional Title again – suggesting more space was a primary consideration in the repurchase.
Property type purchased when previous property was Freehold
Property type purchased when previous property was Estate
Property type purchased when previous property was Sectional Title

.png)
.png)
.png)
.png)