Property Newsletter | September 2021
Property volumes steady, prices up
Higher value properties performing better
Transfer volumes in South Africa have remained consistent between 300 000 to 350 000 a year since 2009, while prices are increasing again after a drop caused by Covid-19 in 2020, when volumes fell 16% compared to 2019 to 260 367.
Transaction value and volume 2008-2021 Q3
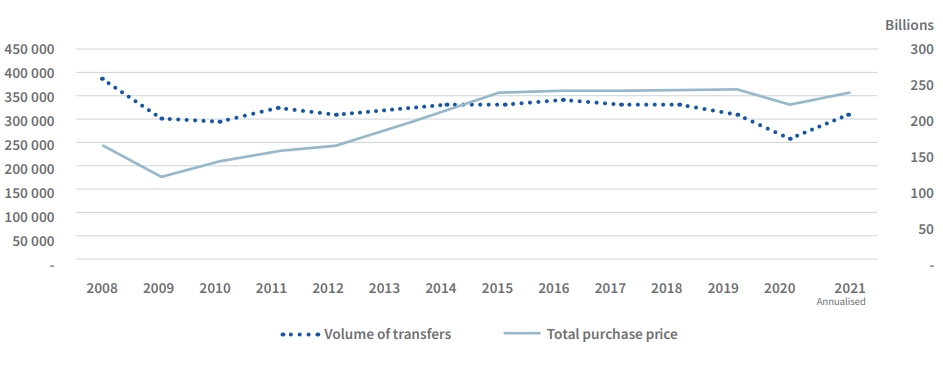
Transfers could return to pre-2020 levels if the current rise in volumes continues, and this could push annualized transfer volumes to 308 000 towards the end of the year.
The total value of purchases in SA has grown exponentially from 2009-2014 and at a faster rate than the volume of properties sold (due to the value band transacting).
Total sales have remained stable at around R240b since 2014, only slowing to R225b in 2020 as Covid-19 lockdowns took their toll.
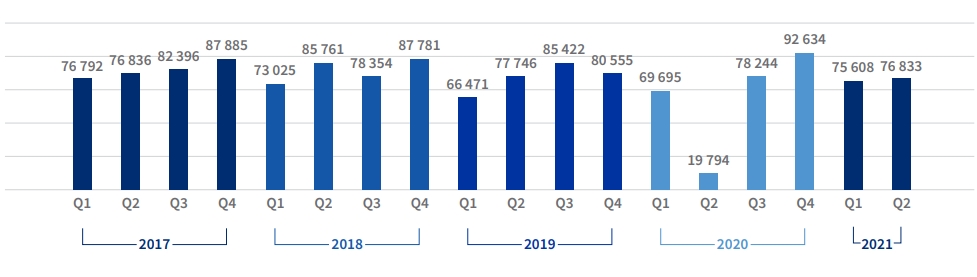
Volumes per quarter
Q1-2021 volumes (graph below) are higher than they have been since the same period in 2018.
While Q2 volumes are not as high as they were in the same quarter in 2018, they are trending towards the 2019 volumes.
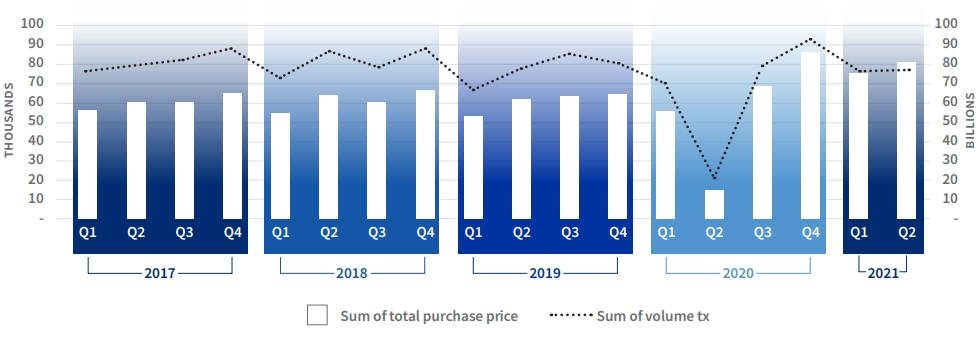
Sum of volumes per quarter
Before Covid-19 in 2020, the total purchase value (graph below) per quarter was +R60b and dropped to around R15b in Q2-2020, when South Africa was in hard lockdown. Since then, it has recovered rapidly and now sits at between R75b to R85b a quarter. Q2-2021 finished off at just under R80b. The higher values and flatter volumes suggest it’s the higher value properties that are transacting. This in turn could indicate greater mobility in the higher wealth bands.
Quarterly comparison between value and volume
Which price bands are growing?
Properties in the R1m – R3m band have grown most significantly over the past 15 years, with the next strongest showing coming from the R3m+ band.
From 2008-2014 most transactions occurred in the R500k and below price band, although declining year on year and in 2015 houses in the R500k – R1m band became most dominant until 2018. The R1m to R3m band took over as the top selling category in 2018 and has fuelled the steep increase in the total purchase price.
Volume of transactions per price band
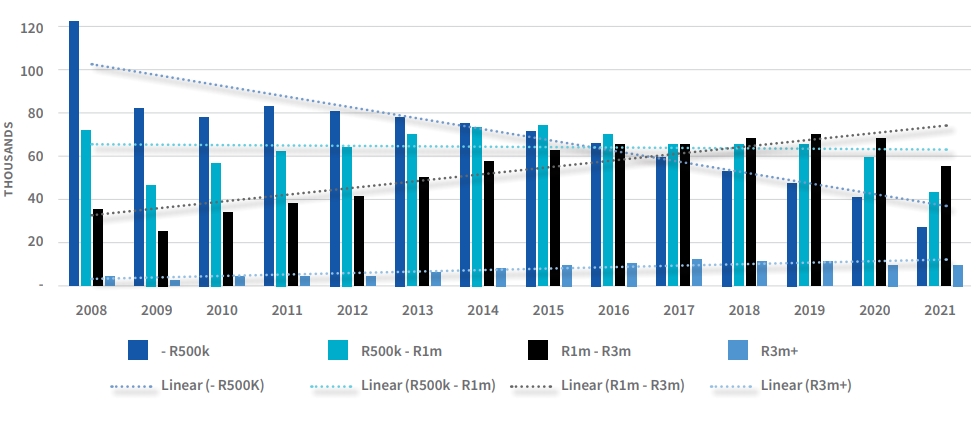
The declining sales in the less-than-R500k market reflects the tough economic circumstances, compounded by the effects of the pandemic. However, it also represents a potential opportunity for lenders if they are willing to provide funding solutions to this segment of the market when the economy eventually grows and employment levels rise.
Time on market
Lightstone wealth segmentation
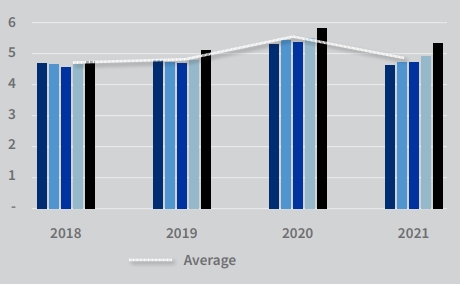
Months on market
The average time it is taking to sell properties has increased to over five months during 2020, especially in the Super Luxury segment. Encouragingly though the time on market has dropped in 2021 to levels slightly lower, on average, than those experienced in any year since 2018.
While there is less time on market in 2021 – especially in the lower segments – the list price to sales price is lower overall especially in the lower price segments (bearing in mind that we don’t have a full view of transfers for 2021).
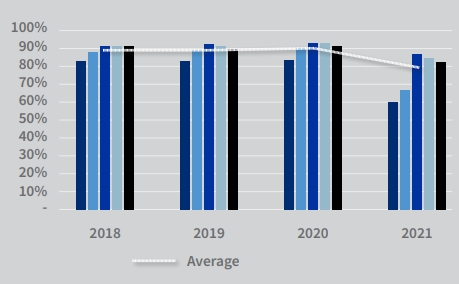
List price to sales
In the Luxury segment, properties are currently staying on the market for longer with sellers settling for lower than listing prices compared to previous years. The High Value segment, however, has experienced a decrease in time on market and a higher percentage of sales are closer to list price when compared to other segments.
In the Luxury segment, properties are currently staying on the market for longer with sellers settling for lower than listing prices compared to previous years. The High Value segment, however, has experienced a decrease in time on market and a higher percentage of sales are closer to list price when compared to other segments.
Price performance recovery of wealth segments?
Inflation per wealth segment
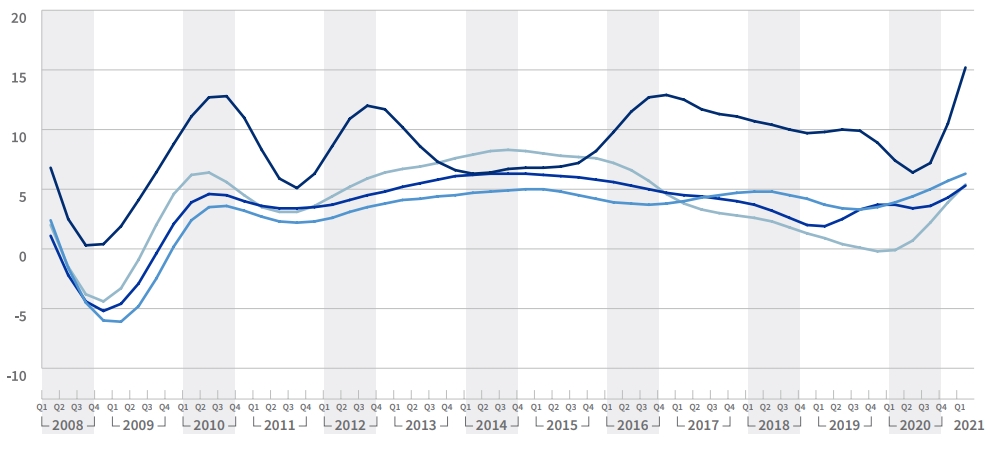
Sales inflation is most pronounced in the Luxury segment, which has recovered from its dip in late 2019 and early 2020. This could be a positive sign for the property market as, historically the luxury segment has led the market through its peaks and troughs. Therefore, hopefully the trend we are seeing in the luxury segment will be replicated by the other wealth segments over the coming year.

Solutions that simplify the complex
Our new website makes it easier to navigate and discover a range of Lightstone products and solutions that make it easier for you to do business.

One place to access your subscriptions
We’ve simplified the complex with a single sign on functionality. Simply login and you will have access to all the products that you currently subscribe to. All in one portal.

What’s happening to the old website?
A few links on our new website may redirect you to certain pages on the old website. This is just a temporary solution to ensure legacy users still have access to certain products.
.png)
.png)
.png)
.png)