Property Newsletter | November 2022
Number of properties in Cape Town almost doubled since 1994
Lightstone’s analysis of selected suburbs shows significant development in Affordable and Mid value properties
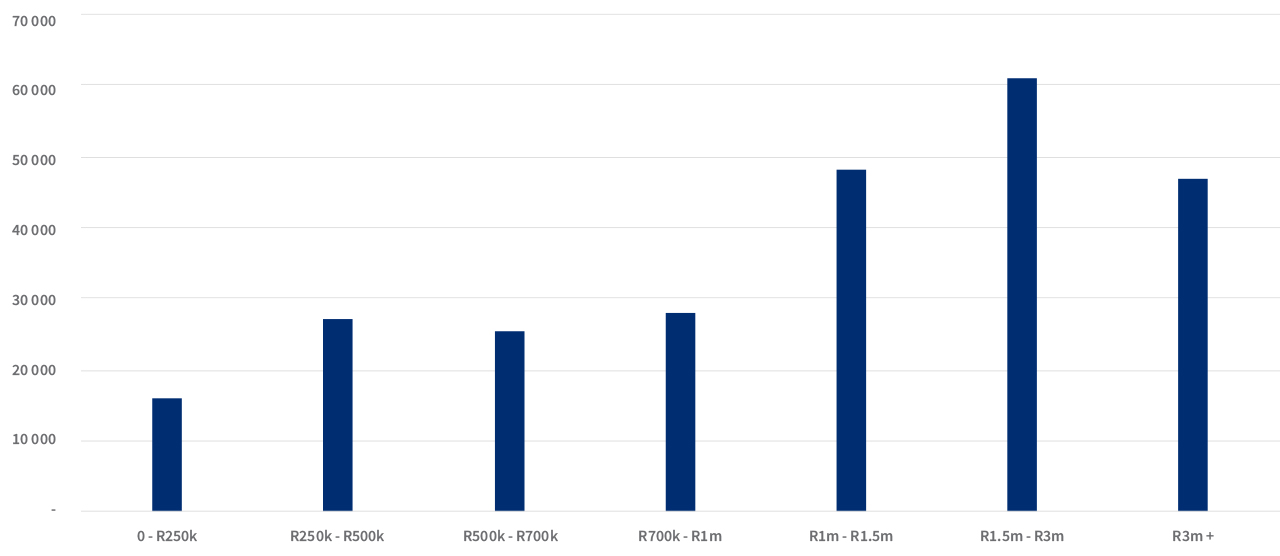
Some 62% of the 251 534 residential properties included in an analysis of selected Cape Town suburbs are valued at more than R1m, with the single biggest category (24%) being the 61 000 properties valued at between R1.5m to R3m.
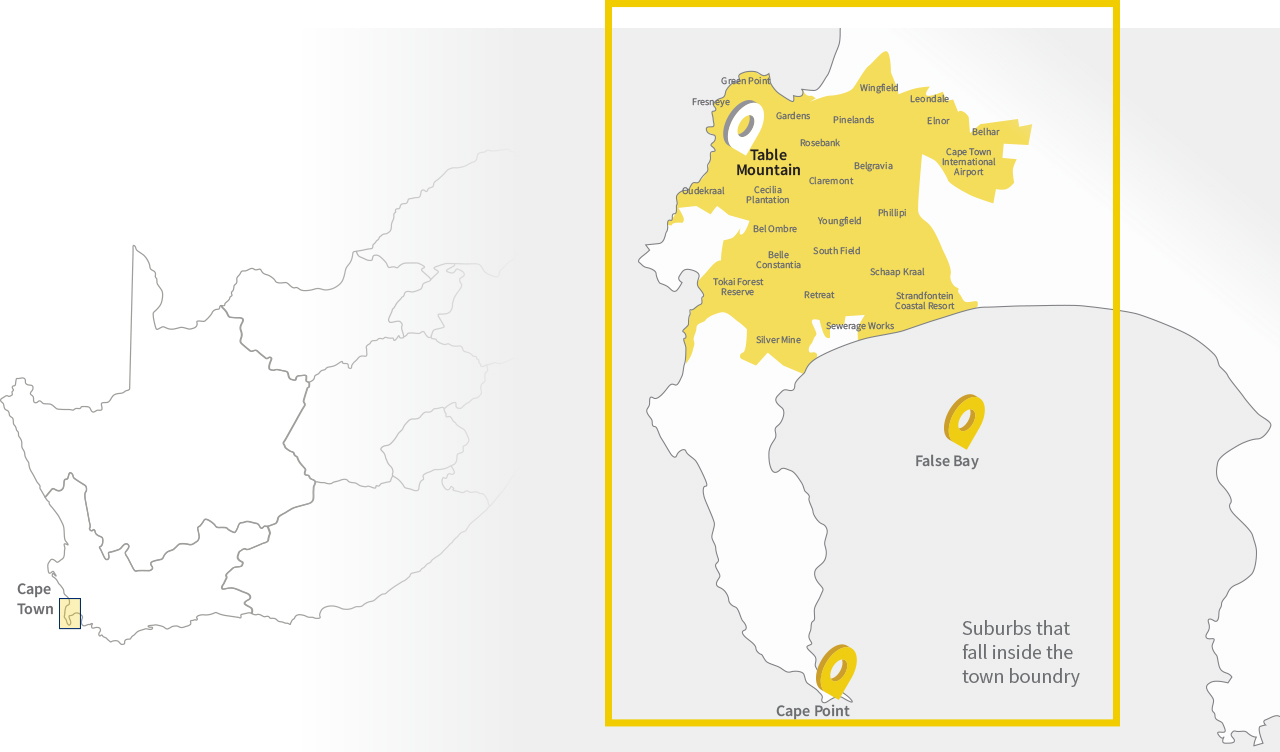
Lightstone’s analysis included the city centre to Silver Mine and Strandfontein on the coast and to Wingfield and the area around the Cape Town International Airport – but excluded Hout Bay, Muizenberg, Noordhoek, Fish Hoek and Simon’s Town on the southern side, Guguletu, Mitchells Plain, Belville and Parow going inland.
Property stock volume per value band: selected Cape Town suburbs
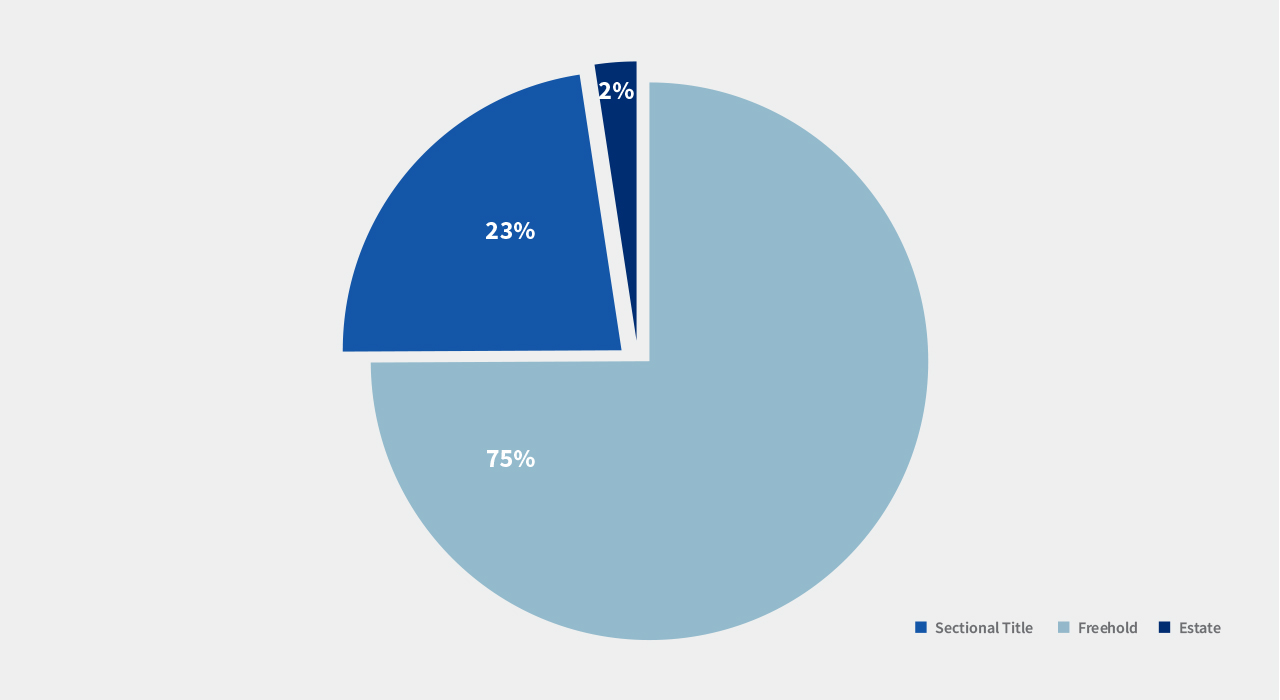
Of the properties analysed, 75% were Freehold and 23% Sectional Title – with Estates accounting for just 2%.
Total stock
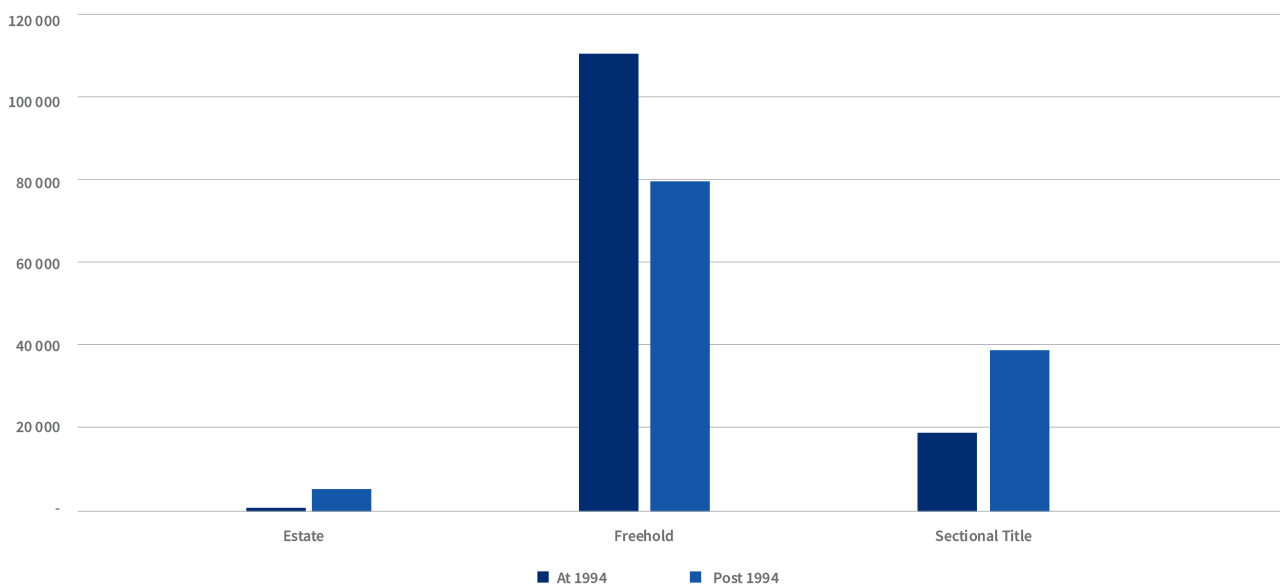
Property development since 1994
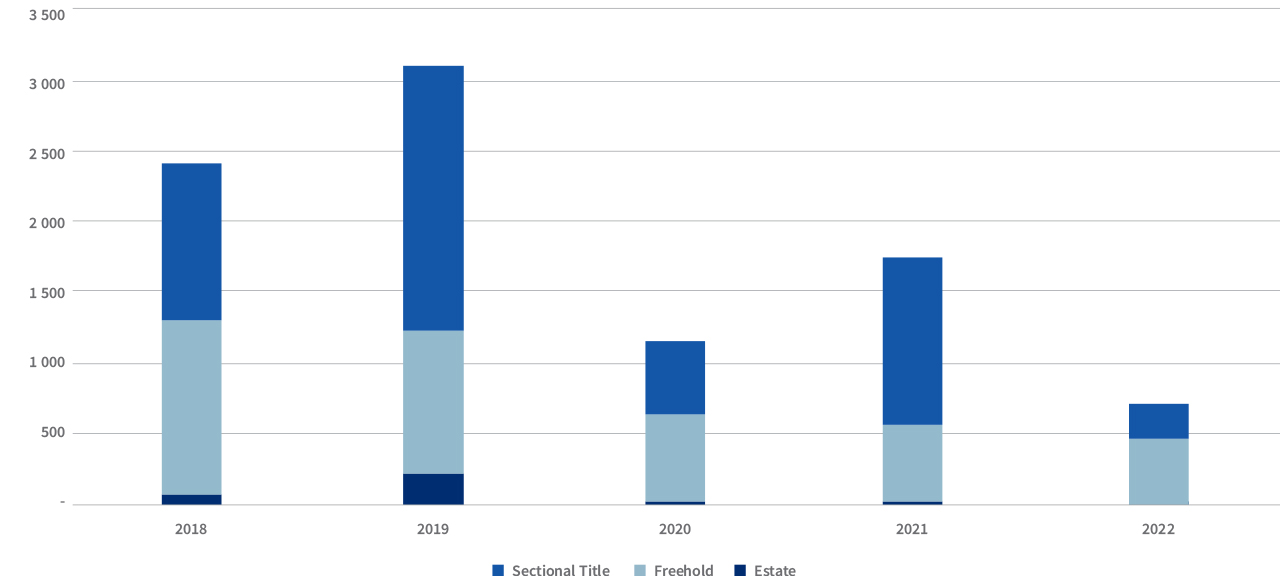
The number of residential properties in the suburbs surveyed have almost doubled since 1994, up from 130 802 to 254 681. Estates have recorded the largest percentage increase but off a small base – from 981 in 1994 to 5 328 being developed post 1994, bringing the total Estate stock to 6 309. Sectional Title properties have doubled – from 19 240 to 38 719 developments post 1994, bringing the total Sectional Title stock to 57 959 while Freehold properties have increased by 79 832 from 110 581 in 1994, bringing total Freehold stock to 190 413.
Cape Town selected surburbs development post 1994
Development fell sharply during 2020 (see graph below), when Covid wreaked havoc with the economy, but development accelerated in 2021.
New development by property type
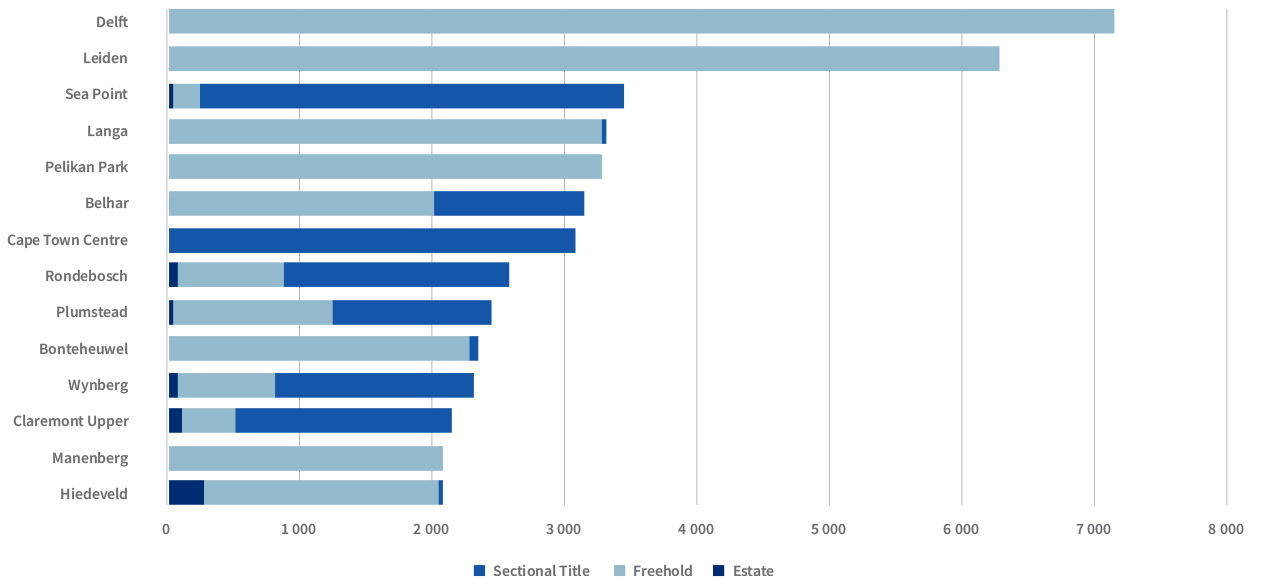
Residential property development in the suburbs analysed (see graph below) is taking place predominantly in townships around the city, with Delft, Leiden, Langa and Pelikan Park sandwiching Sea Point in the top five – and while Sea Point is predominantly Sectional Title development, the four townships feature only Freehold development.
Suburbs where development occured
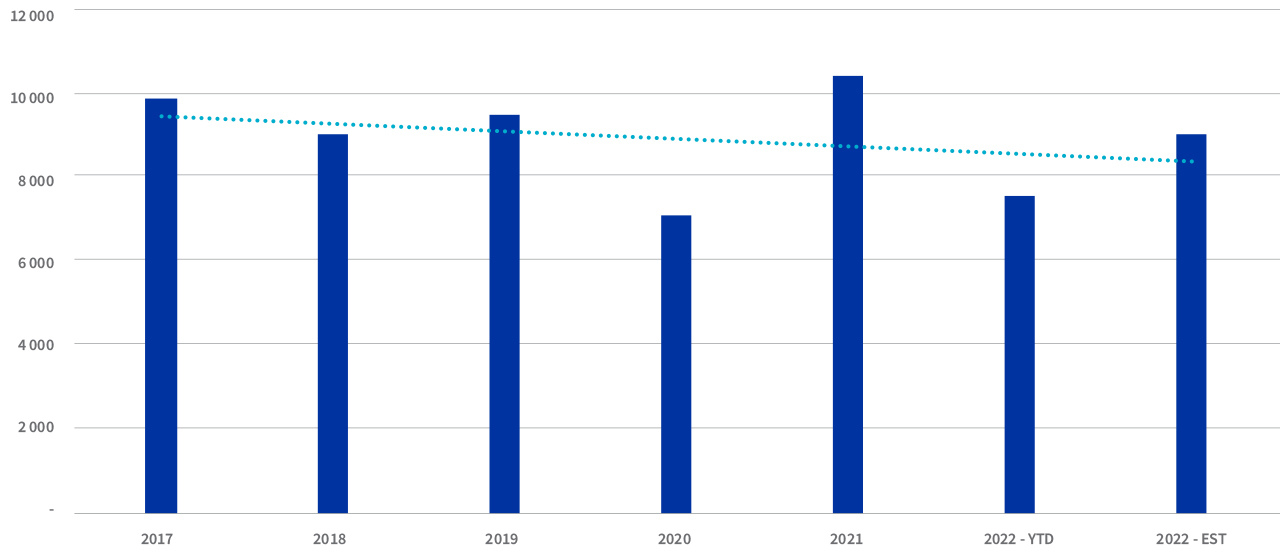
Transfer volumes showing decline
Transfer volumes in the surveyed suburbs have been uneven in the last few years. The graph below shows a decline in 2018 from 2017, then an increase in 2019 before the Covid-induced fall in 2020. There was a strong recovery in 2021 and 2022 projections suggest transfers will top 9 000 – up on both 2018 and 2020, but down on 2017, 2019 and 2021.
Sum of transfer volumes
Most transfers above R1m
Value bands transacting: 2017-2022
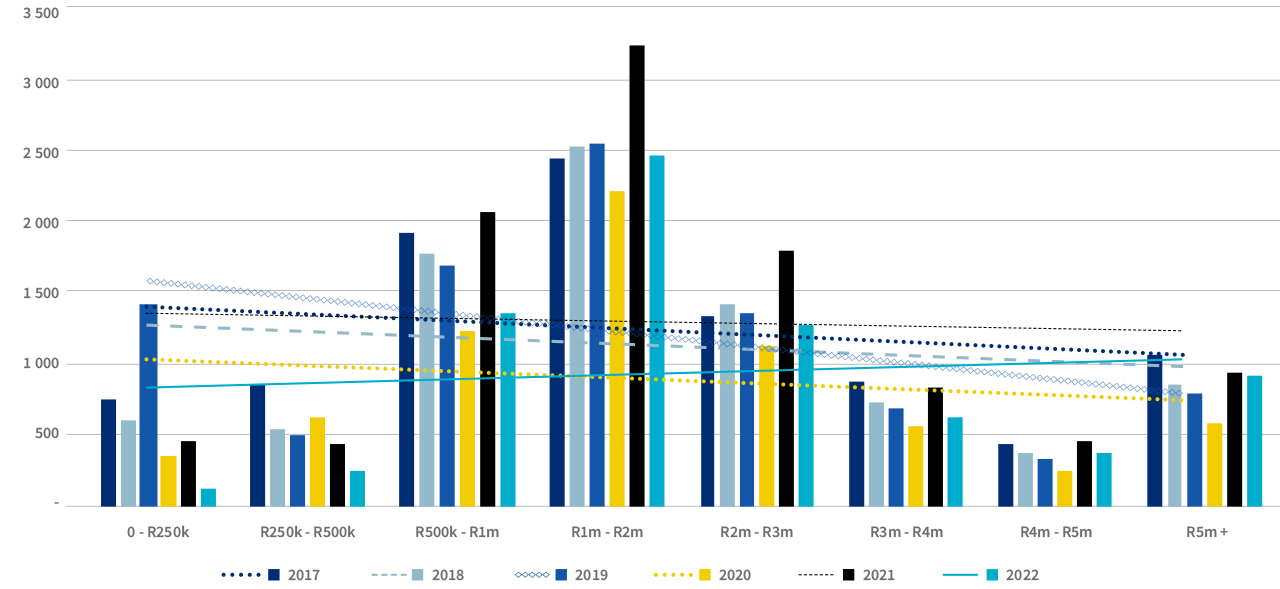
Despite the bulk of new developments taking place in townships or lower price bands, most transfers have been taking place above R1m (see graph above) and they are on an upward trend, while the lower bands – <R250k, R250k-R500k, R500k-R1m – have been declining in volume terms.
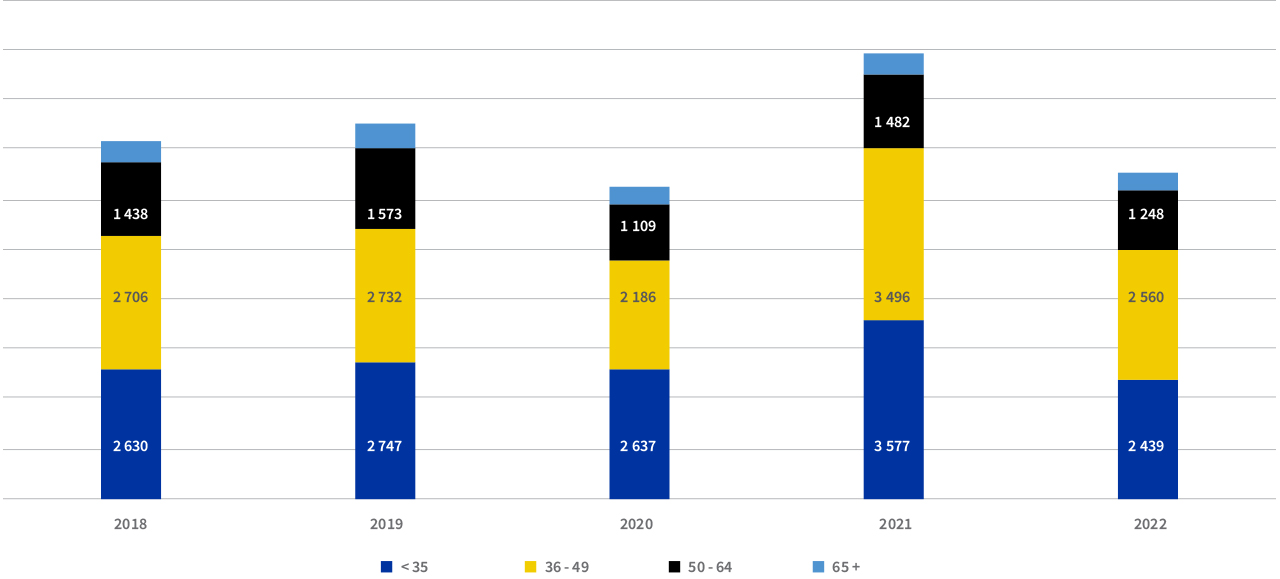
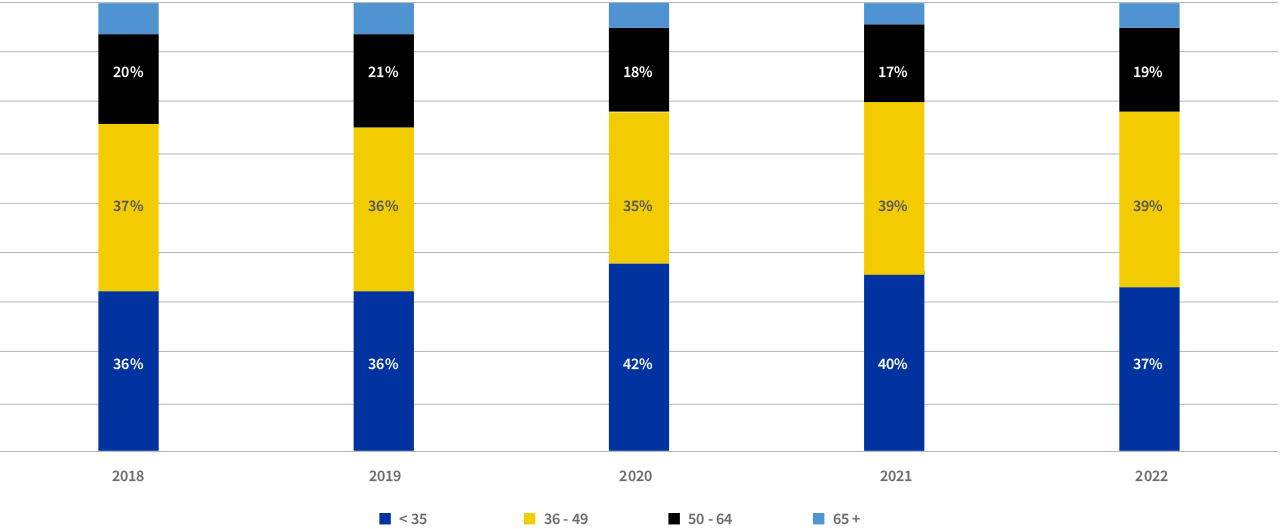
Buyers under 49 dominate the market, accounting for more than 70% in any of the years reviewed.
Who is buying?
% split of buyers
.png)
.png)
.png)
.png)