Property Newsletter | September 2023
SA residential market nears R7t in value
House price inflation flat, WC in demand from those switching provinces
South Africa’s residential property market’s stock value currently stands at just more than R6.8 trillion (August 2023).
Current stock value: R6.8t
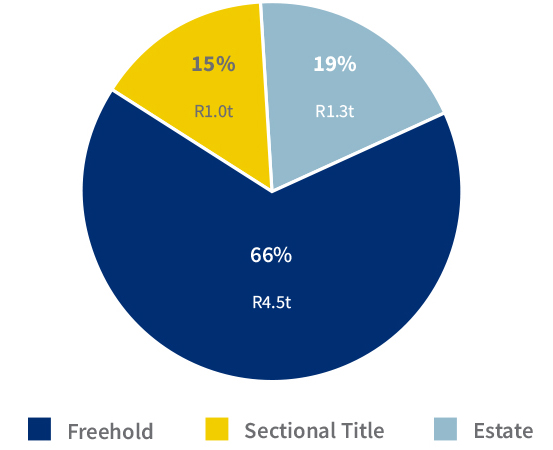
Current stock volume: 7 035 632
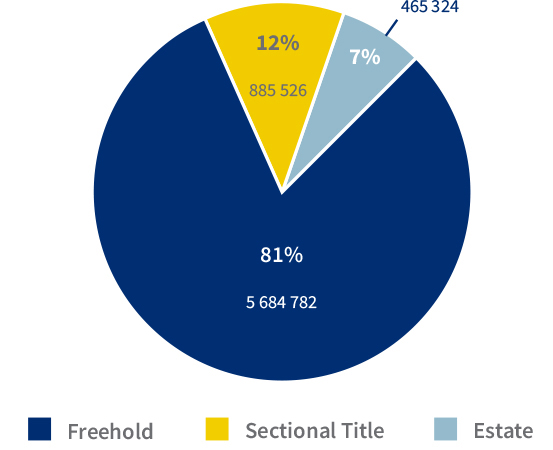
In terms of volume, Freehold accounted for 81% with 5 684 782, followed by Sectional Title at 885 526 (12%) and Estates at 465 324 (7%).
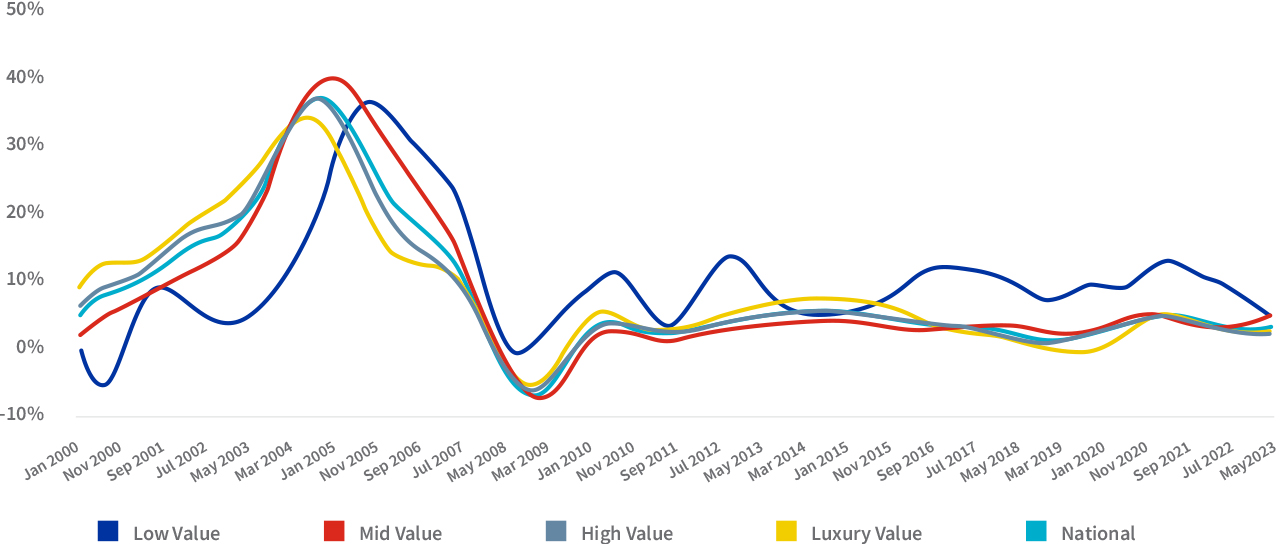
House price inflation has averaged between 2% and 6% since the market crash of 2008/9, and is well short of the 37% recorded in the heady days of 2004/5. Lightstone’s Low Value segment has been the best performing over the last 22 years, although in 2023 it has drifted towards the 4% level where Mid Value, High Value and Luxury Value are to be found.
House price inflation by Lightstone value band
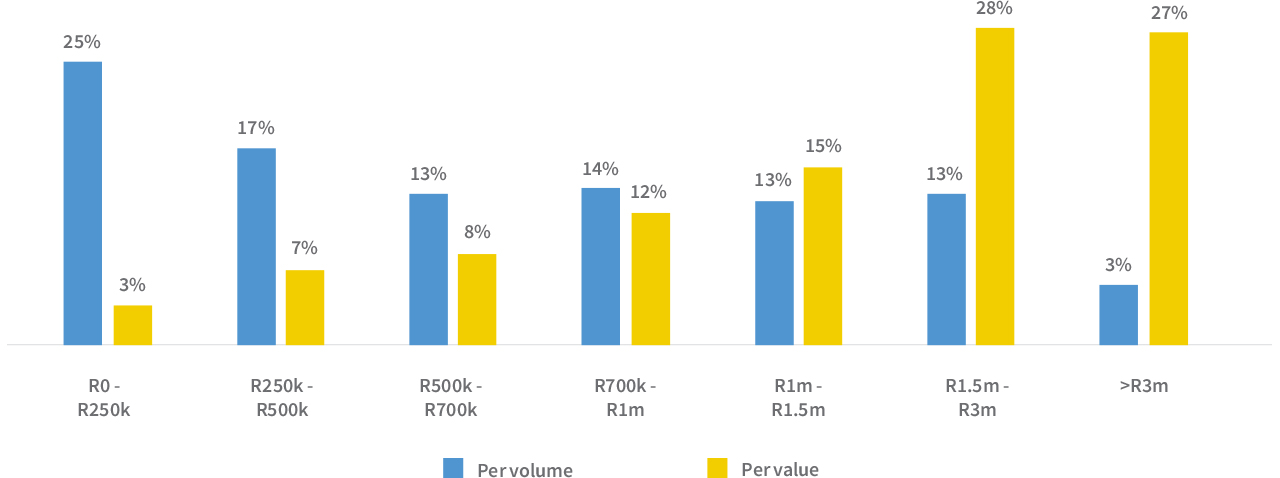
The lowest and highest valuation price bands have almost diametrically contrasting weightings – properties under R250k in value account for 25% of the volume but just 3% of the total value, while properties above R3m in value account for just 5% of the volume but 27% of the value.
Properties under R1m in value account for 69% of the volume but only 30% of the value. This means that 70% of the country’s property value lay in 31% of the volume.
Value and volume of stock by valuation band
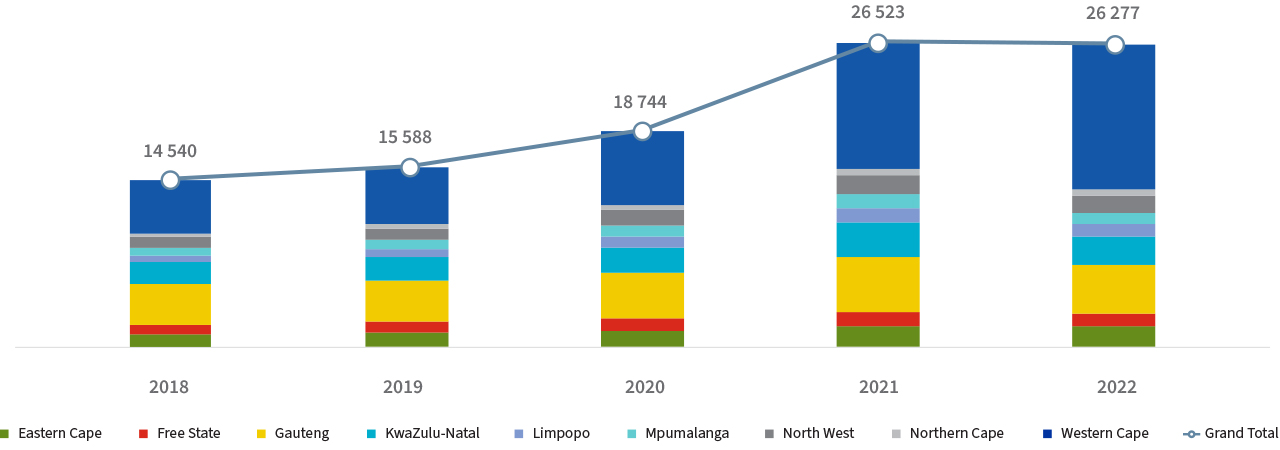
The data shows the migration to the Western Cape is on an upward trajectory, with the province being the number one choice in each of the year’s under review – and climbing year by year from 2018 to 2021, before levelling off in 2022.
Migration to province
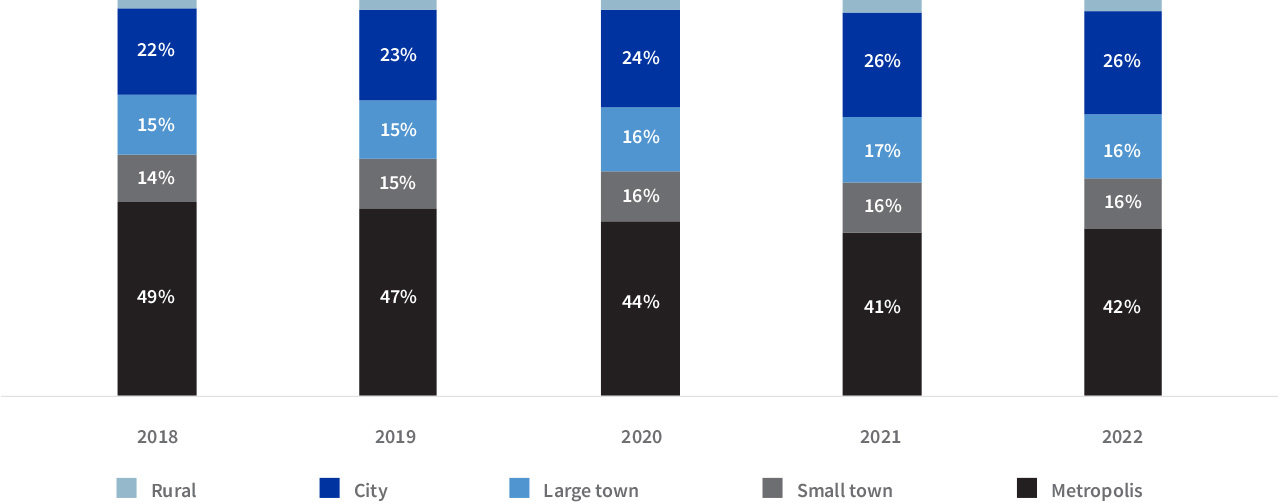
While the Western Cape remains the most popular choice for those switching provinces, most migrating homeowners opt for metropolis living, albeit on a reducing basis (from 49% in 2018 to 42% in 2022). The attraction of small-town living is growing, with migration numbers increasing from 22% in 2019 to 26% in 2022.
Migration to type of town
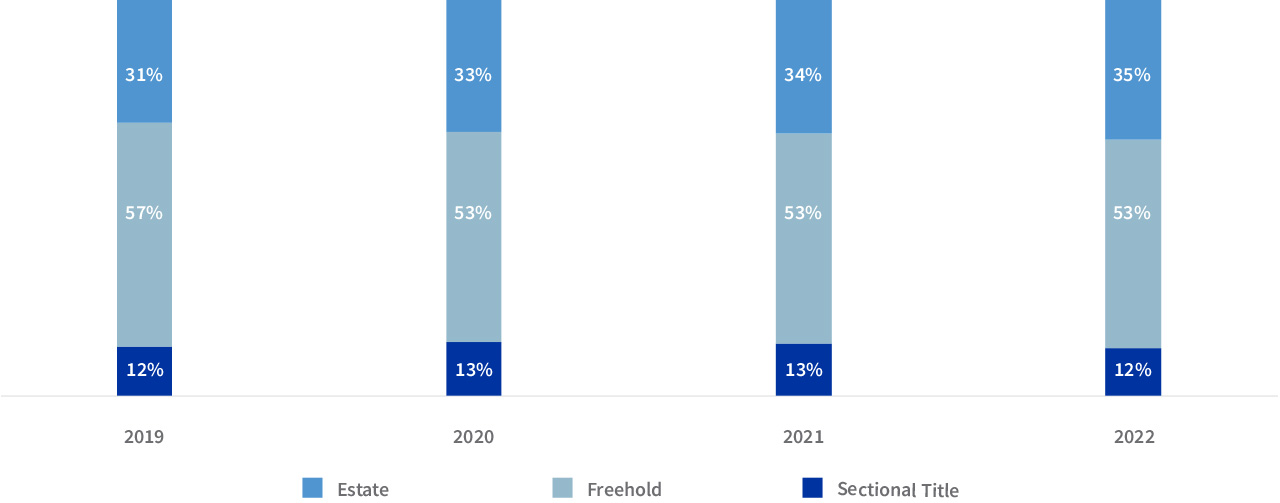
First time buyers prefer Freehold properties (see graph below) although the percentage dropped from 57% in 2019 to 53% for 2020, 2021 and 2022. Sectional Title went from 31% in 2019 to 35% in 2022, and Estate’s remained consistent at 12% in 2019 to a high of 13% in 2020 and 2021 and then back to 12% in 2022.
Type of properties purchased by first time buyers
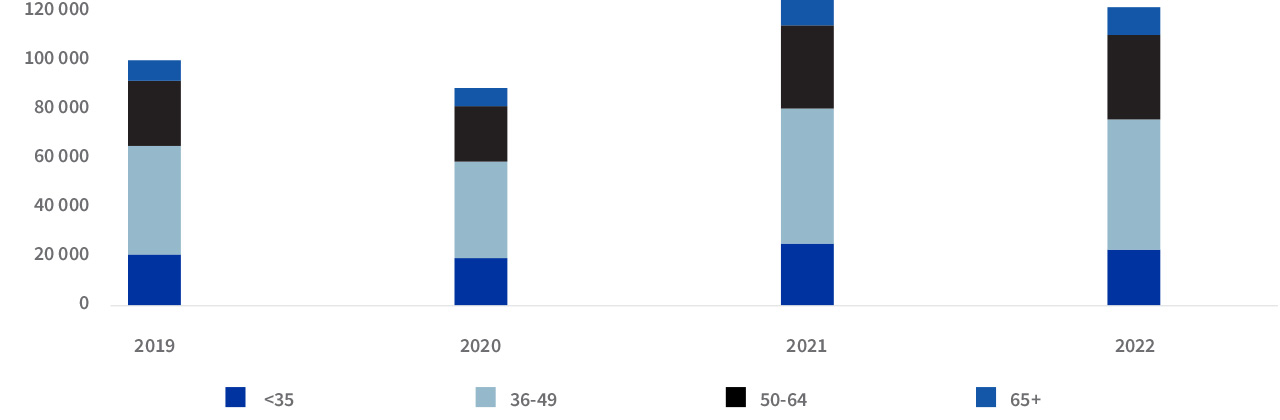
Most buyers are in the 36-49 year band (see graph below), followed by those aged between 50-64, with younger buyers – those under 35 – accounting for third most buyers, followed by the smallest category of buyers, those above 65.
Age of buyers
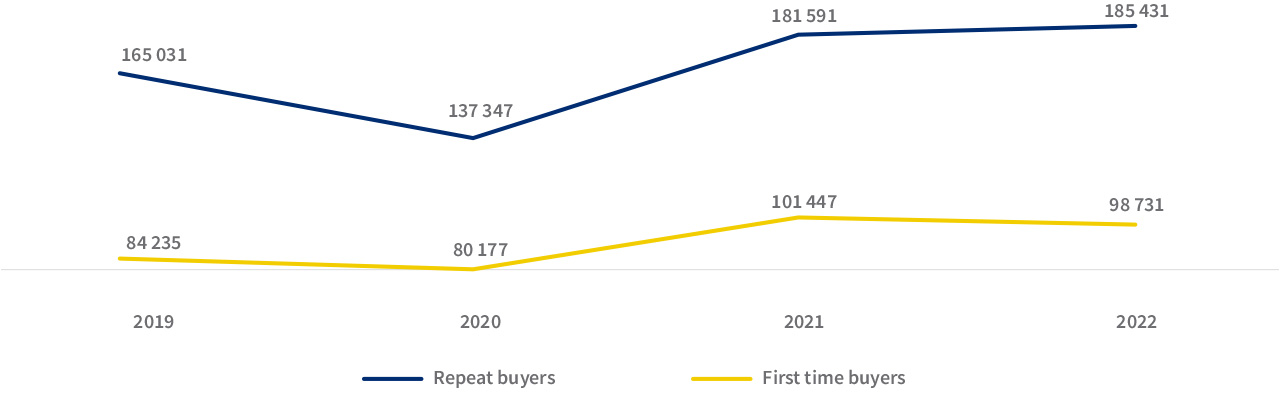
The number of first time buyers dropped marginally in 2022 from 2021, although it was still comfortably higher than the figures recorded in 2019 and 2020. Repeat buyers, on the other hand, increased in 2022 when compared to 2021, recording the highest number in the period under review.
Repeat vs first time buyers
.png)
.png)
.png)
.png)