Property Newsletter | March 2023
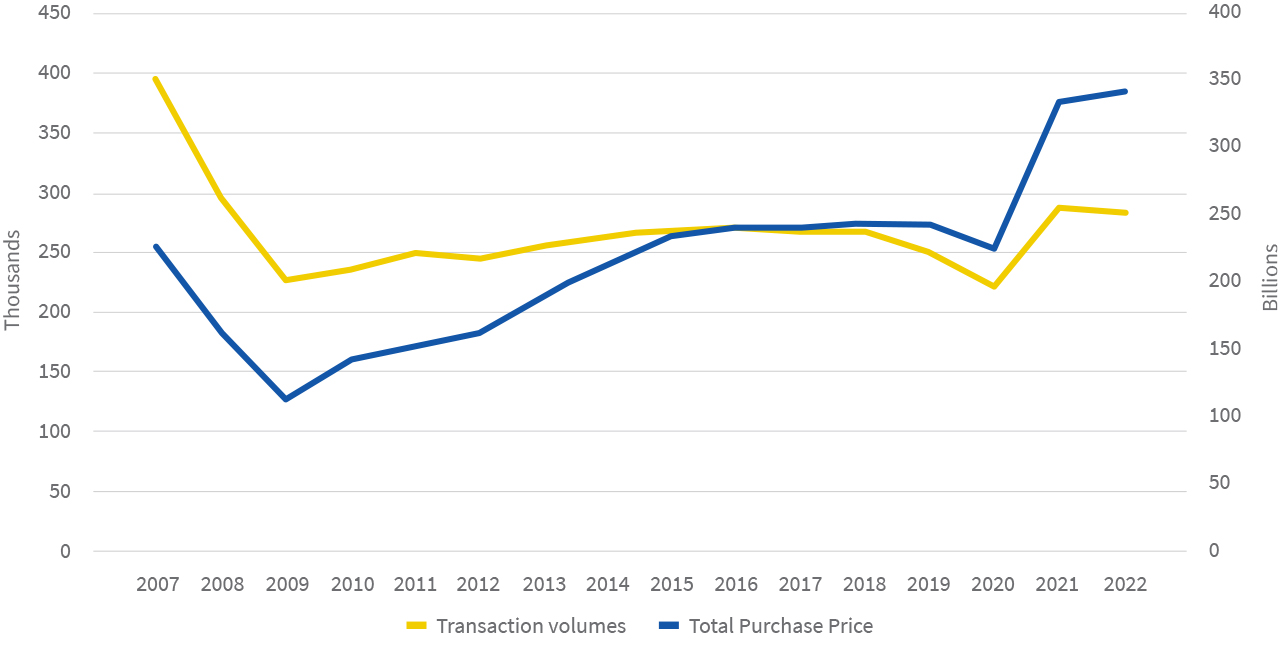
Residential property sales volumes at highest since 2007-2008...
...but declining activity at entry levels a cause for concern
Residential property sales volumes pulled back in 2022 after a strong post-Covid-19 recovery in 2021, while transaction values continued to increase, albeit more slowly in 2022.
Volumes were highest in 2021 and 2022 since the fall in sales in 2007/2008, following the financial markets crash.
Total volume of transactions vs value of transactions
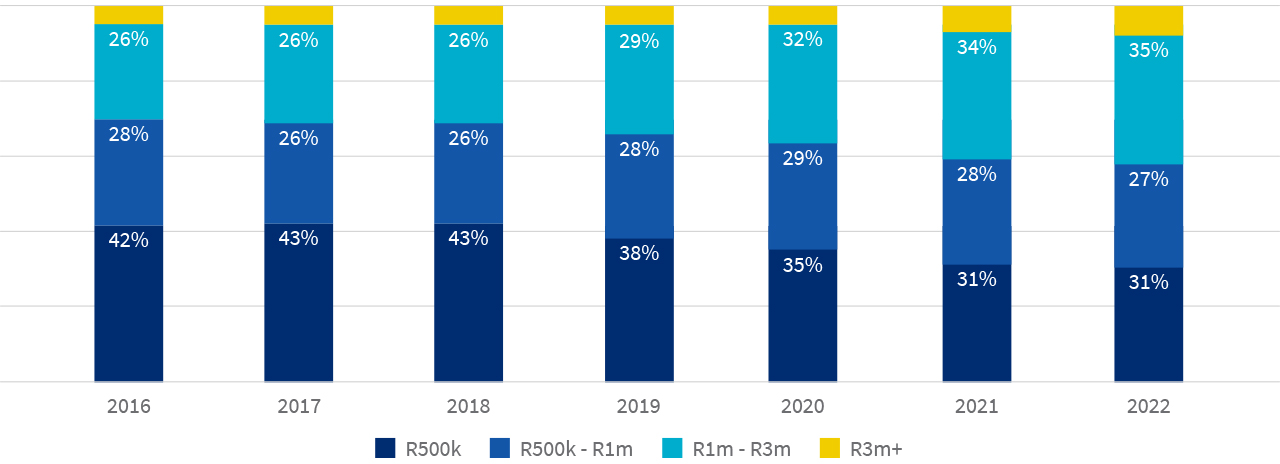
Purchase band shifts over the past seven years (see graph below) suggest that tough economic conditions are impacting entry levels - transaction volumes in the under R500k band have dropped from a high of 43% in 2018 to 31% in 2022, while transaction volumes in the R1m-R3m band have risen from 26% in 2016 to 35% in 2022.
Volume of transactions by purchase band
Percentage of transactions per property type
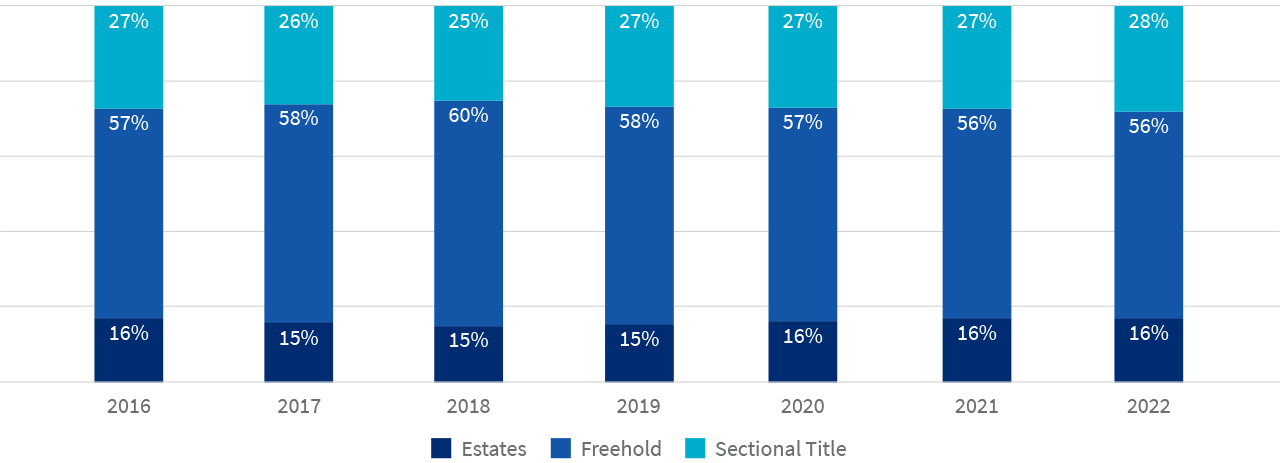
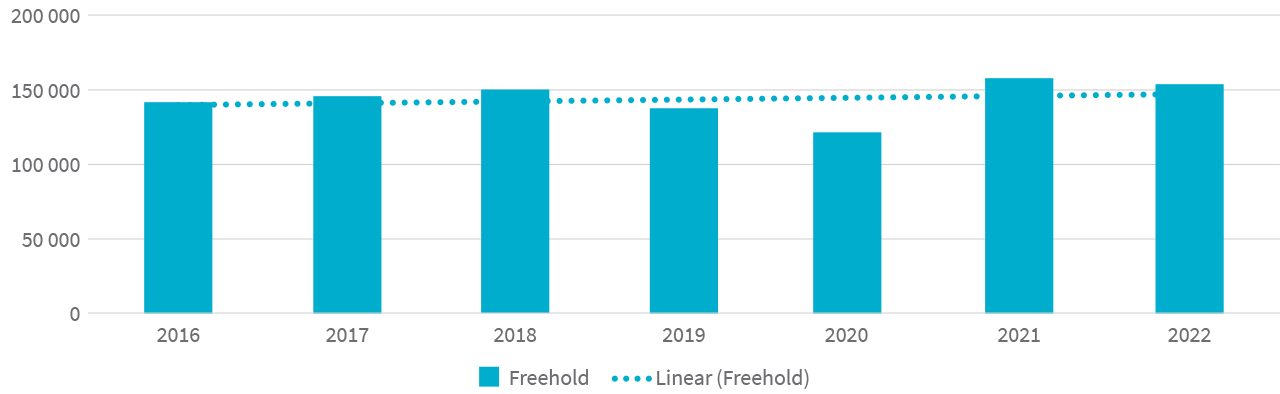
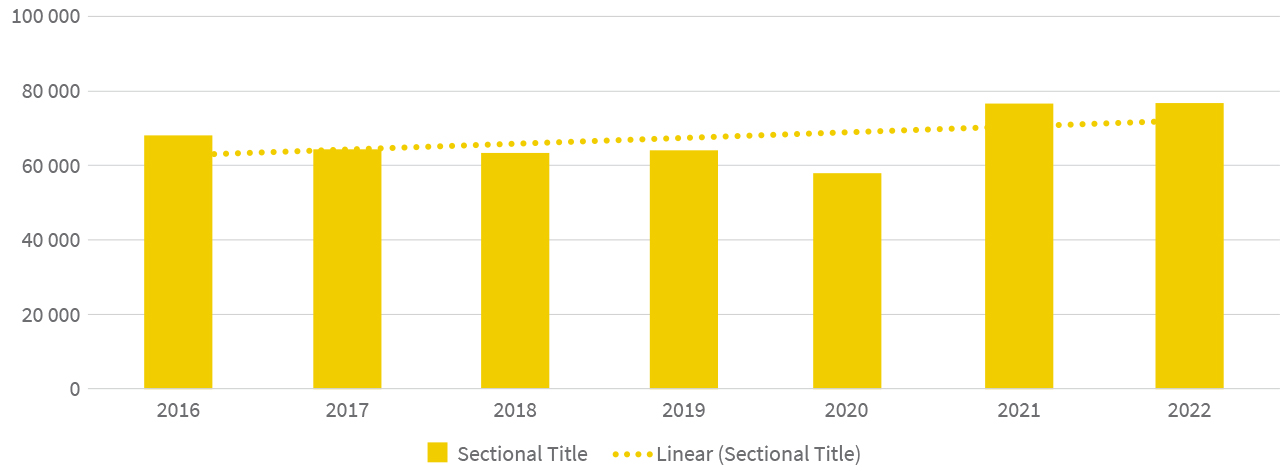
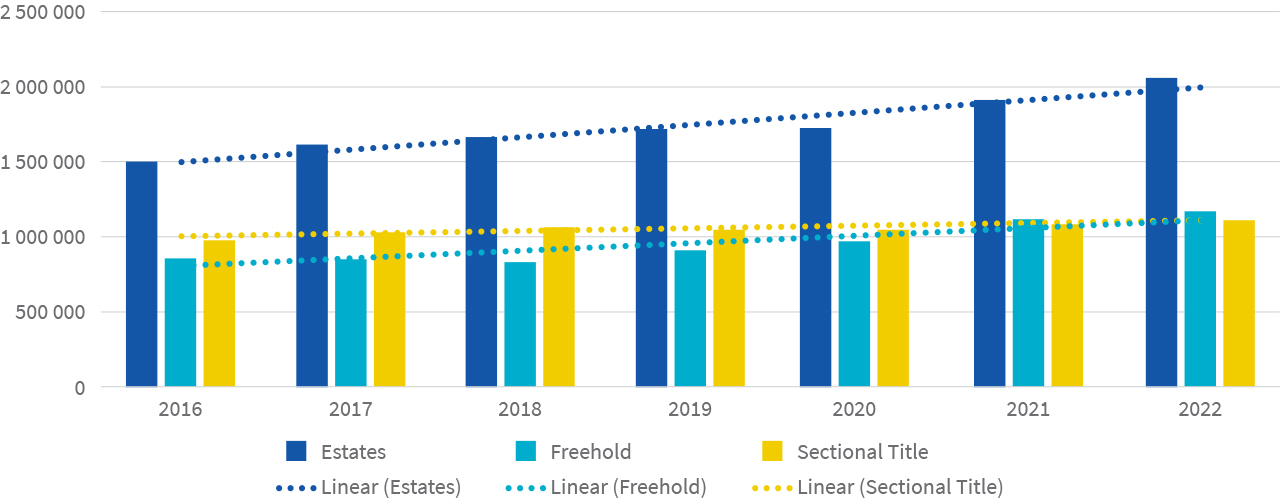
The apparent decline in sales volumes of Estates from 2016 to 2019 was strongly reversed in the post covid years of 2021-2022. The data confirms the trend away from Freehold property, as reported in our February newsletter. Freehold transactions have fallen from 60% in 2018 to 56% in 2022, while Sectional Schemes have risen from 25% in 2018 to 28% in 2022, and Estates from 14.8% in 2018 to 16.2% in 2022.
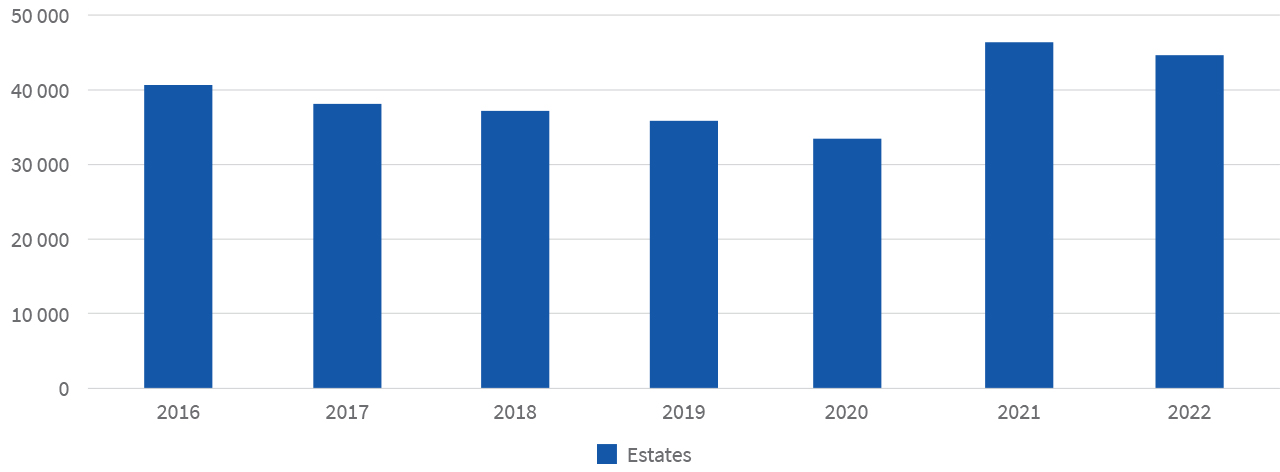
The three graphs below show the current volume growth in Estates and Sectional Schemes versus a flattening out of Freehold.
Transaction volumes - Estates
Transaction volumes - Freehold
Transaction volumes - Sectional Schemes
Value
The average price paid for Estates and Freehold in 2022 was 36% higher than in 2016, while the average price paid in Sectional Schemes had risen by 13%.
The graph below shows the strong performance by Estates.
Average values 2016 - 2022
Provincial breakdown
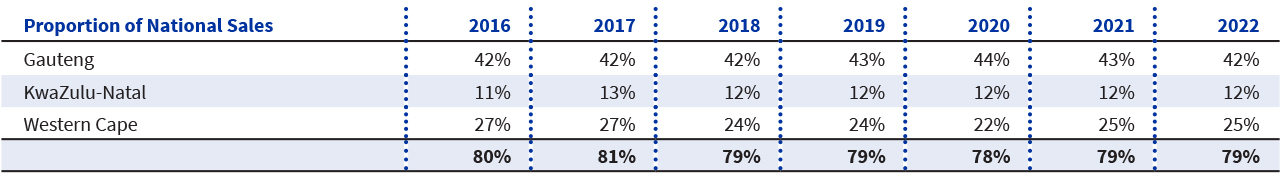
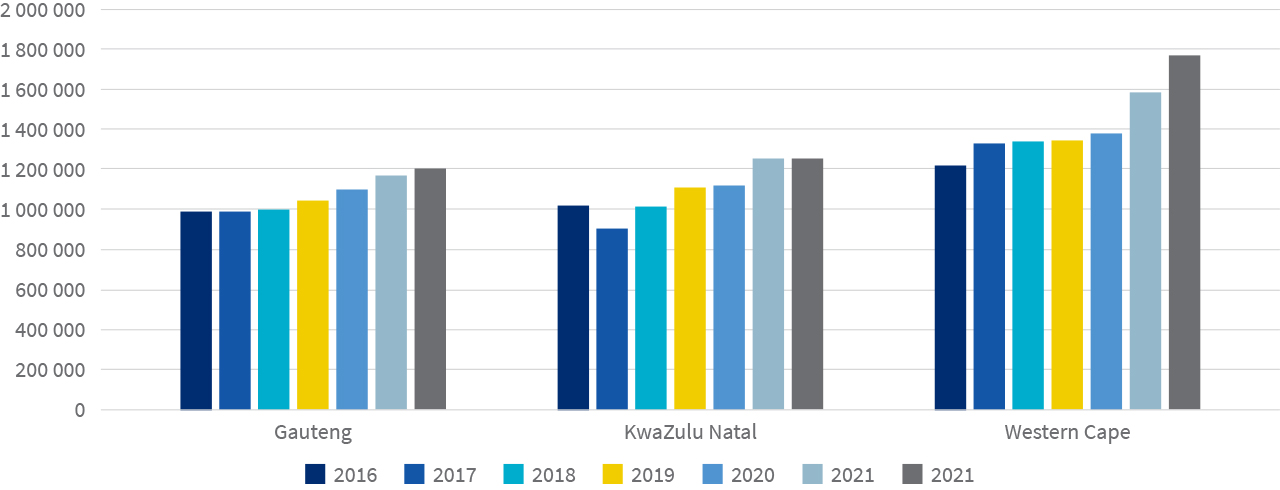
Gauteng, Western Cape and KwaZulu-Natal made up around 80% of all sales, although volumes declined in Gauteng after Covid-19 and accelerated in the Western Cape, which previously saw similarly high sales in 2016 and 2017.
In terms of value, the Western Cape performed better on average than the other two provinces (Gauteng and KwaZulu-Natal). The increase in 2022 relative to 2016 has been significantly higher in the Western Cape than other provinces, reflecting in part the migration of people to that province in search of better governance.
Average transaction price per province
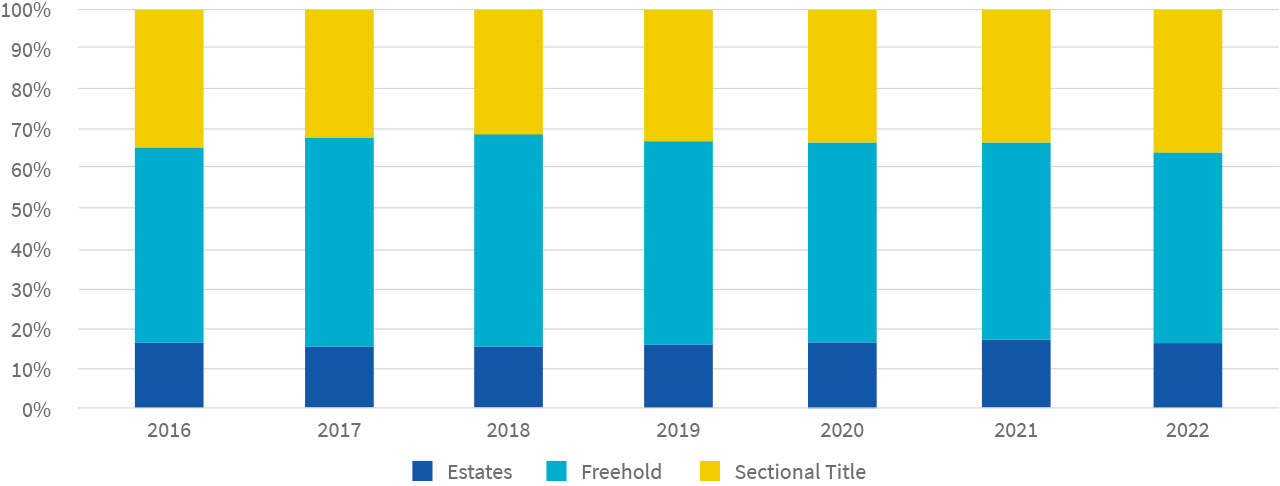
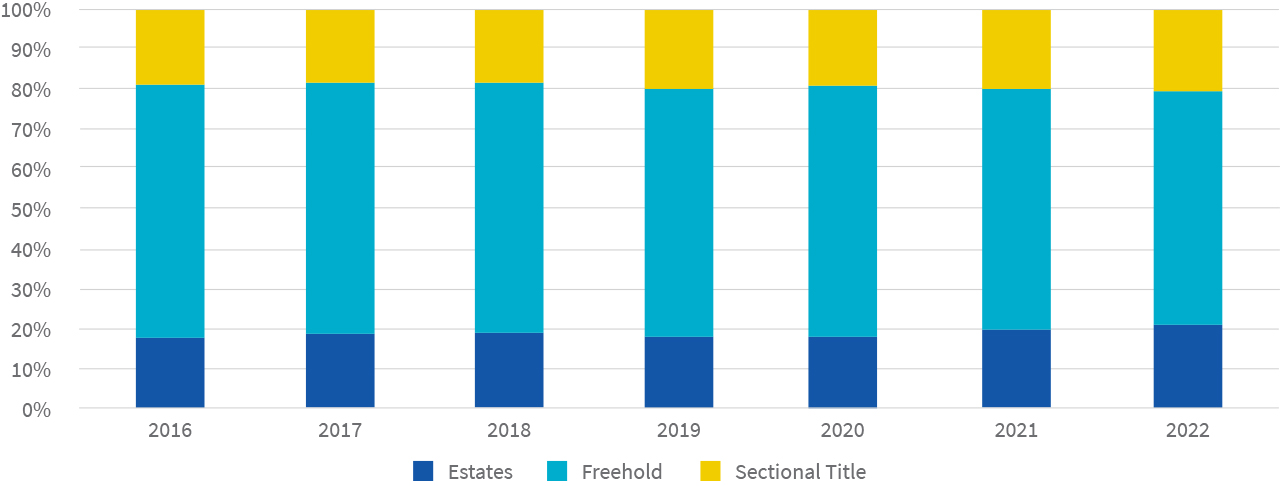
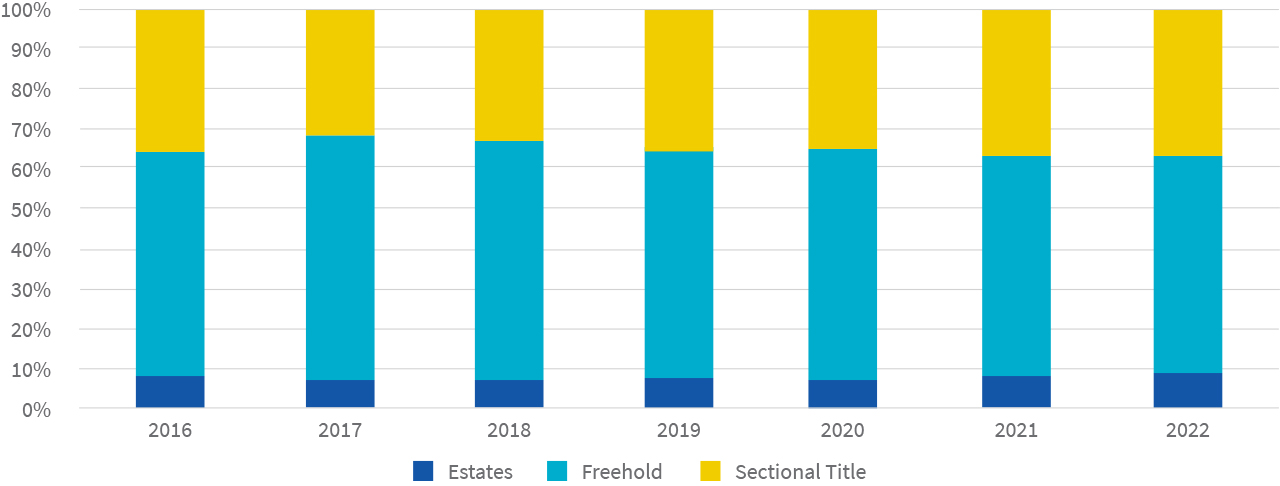
In terms of transaction volumes by property type per province, Freehold remains the largest in each province but under pressure from Sectional Schemes and Estates. The mix of transactions by property type is fairly constant in Gauteng and the Western Cape, while KZN shows a growth in Sectional Title purchases in 2021 and 2022.
Gauteng: Transaction of volume by property type
Western Cape: Transaction of volume by property type
KwaZulu Natal: Transaction of volume by property type
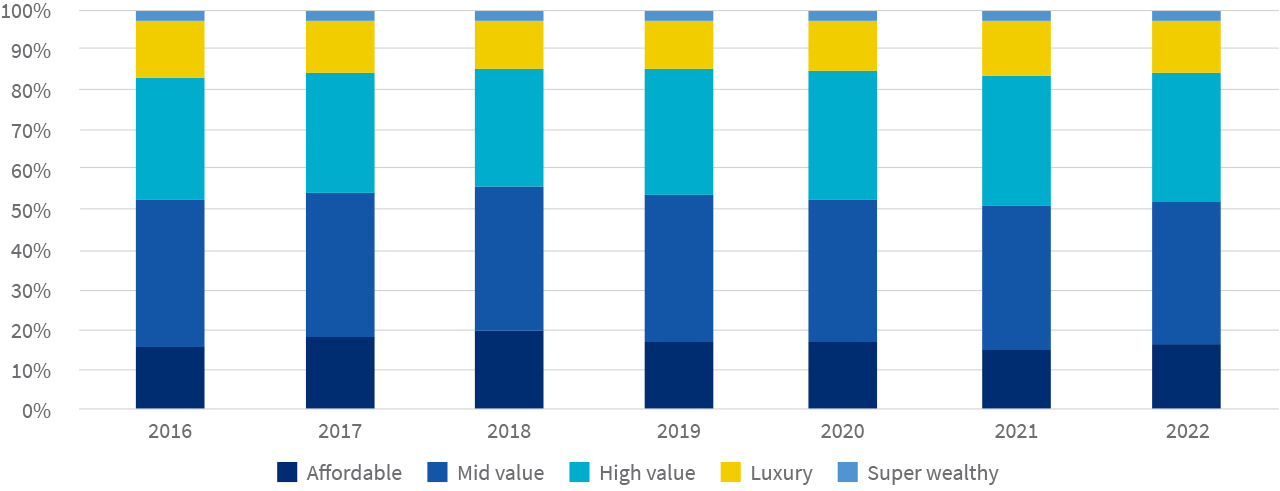
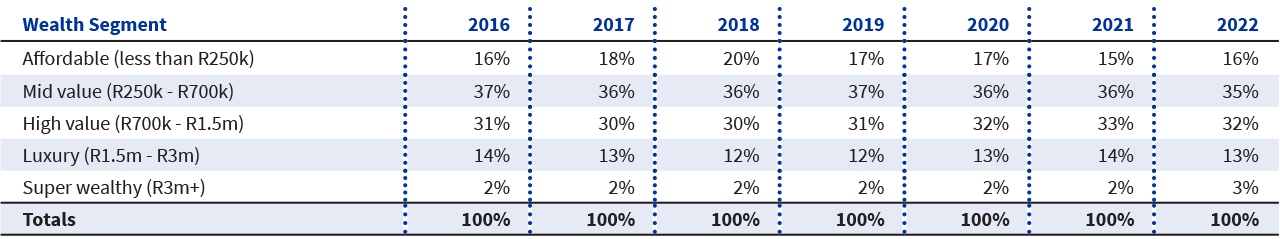
Wealth segments
By 2022, sales in the Super Wealthy category had increased by 30% on 2019 levels, albeit off low numbers, whereas Mid Value grew by just 10%.
However, the average transaction value of Mid Value properties in 2022 was 25% higher than in 2019, whereas only 14% higher in Luxury and Super Luxury.
Proportion of property transactions per wealth segment
.png)
.png)
.png)
.png)