Property Newsletter | June 2023

Where have all the under 35 property buyers gone?
And Mpumalanga in the spotlight
Not only are South African youth buying fewer properties, their buying patterns have also changed and they are increasingly buying solo. Mpumalanga, a province high on tourists’ lists, has most of its formally registered houses in Emalahleni, but the greater value is to be found in Nelspruit. The Property Market Leaders’ Insights Webinar and Lightstone’s HPI for May, is all packed into this issue of Property Newsletter.

South Africa’s youth buying fewer houses and cars
If you’re a Lightstone Property client, this is a reminder that Lightstone is also the go to for Auto data. In this article we share data showing that South African youth are buying fewer properties and the proportion of cars being sold to the youth is also down on ten years ago.
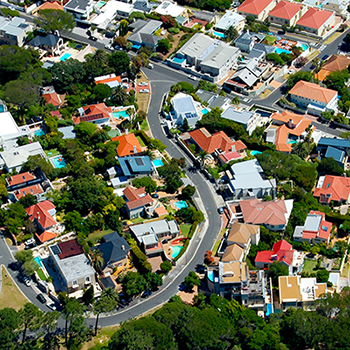
Mpumalanga’s varied property landscape
Just more than two thirds (69%) of households in Mpumalanga live in informal settlements with the balance (31%) living in properties registered at the Deeds Office. 84% of all the province’s people live in urban areas, which is one of the highest in the country.


ICYMI: The Property Market Leaders’ Insights Webinar
Recently, Lightstone Property’s Head of Digital, Hayley Ivins-Downes, joined TPN’s Head of Marketing, Waldo Marcus, on a TPN webinar that brought the two leaders in property data together to share their insights and data to give you a complete picture of how the residential property market is really performing in the current economic environment. This exclusive webinar uncovered the valuable data, benchmarks, trends, and opportunities for the residential property industry. If you missed it, watch the recording here.
House Price Index
Lightstone’s analysis of the national year-on-year house price inflation is at 3.77% for May, up from 2,64% on the prior month. Annual property inflation in the Low Value segment was once again much higher than that in other segments at 8.5%, compared to 4.3% for properties in Mid Value segments. For a detailed analysis at provincial and municipal level, take a look at our monthly Residential Property Indices Report.
.png)
.png)
.png)
.png)